How to Make a Pitch Deck
A fundraising pitch deck is like a story: it takes many forms but has best practices. I’ll cover these practices with examples and checklists for each slide.
If you’d like feedback on your pitch deck after applying this guide, email me at [email protected] and I’ll try to help.
The Goal of a Pitch Deck
When a pitch deck is sent remotely, the goal is to get a meeting and thus the deck should make sense as a stand-alone story.
When a pitch deck is used in a meeting, the goal is to get the next meeting and the deck should be a visual aid, not a script to be read.
Ideally, your remote vs. in-person pitch decks would be different – remote decks need more detail since you can’t explain them personally – but this is often not worth the effort. Just keep both contexts in mind.
Report vs. Story
A pitch deck should tell a story, not a report.
- Many details
- Abrupt transitions
- Dry
- Impersonal
- Key details
- Fluid transitions
- Engaging
- Personal
“Investors invest in stories, not businesses.”
-Babak Nivi, AngelList co-founder
Investors want a story for several reasons:
- They want to invest in inspirational characters: the founders.
- Mission-driven founders are often motivated by a personal story.
- Good pitches are internally consistent, like good stories.
- Our brains absorb stories better, especially after hearing five pitches a day.
Overall, a pitch deck should be five Cs: clear, clean, concise, credible, compelling.
Core Sections of a Pitch Deck
The pitch deck’s core sections should cover the following topics, roughly in this order:
| 1. Title | 8. Traction |
| 2. Mission | 9. Business Model |
| 3. Team | 10. Marketing & Sales |
| 4. Problem | 11. Competition |
| 5. Solution | 12. Financials |
| 6. Market | 13. Use of Funds |
| 7. Why Now | 14. Conclusion |
Some sections need only one slide and some need two or three. Try to keep your pitch deck under twenty slides. DocSend’s analysis of 200 pitch decks found the average deck had 19 slides and a viewing time of 3 minutes, 44 seconds. Every extra slide risks boring your audience so be efficient.
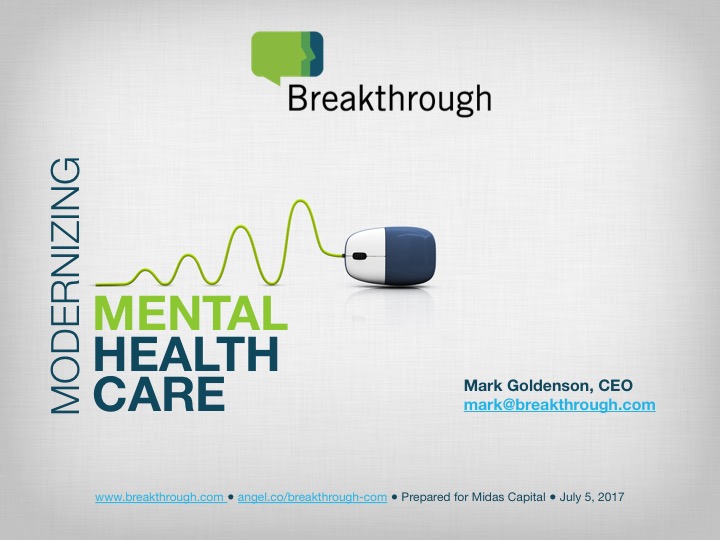
Title
The title slide gives investors context and key information.
Title Slide Checklist
- Company name, logo, and maybe slogan
- Presenters’ names, titles, and email addresses
- Website URL
- AngelList URL
- Corporate social media handles, if they’re active
- Current date
(The current date helps investors timestamp your progress if you pitch them more than once.)
Mission
The mission slide should describe what you do in one simple sentence.
The mission should hook your audience so they want to learn more, not describe everything you do. It can describe a grand vision but I think early-stage startups should be realistic first to earn credibility.
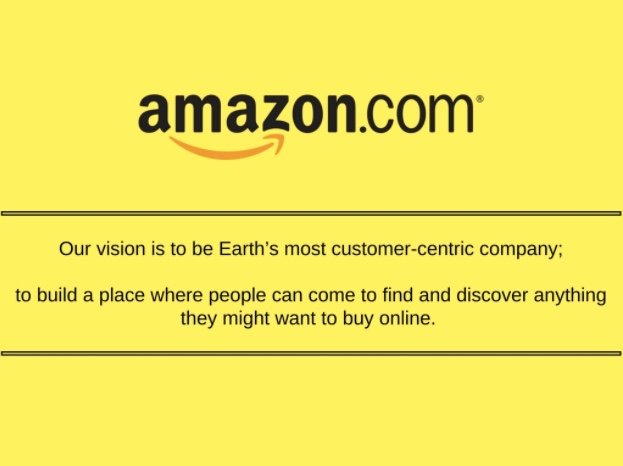
- Amazon’s mission, 1995: “Be America’s best online bookstore.”
- Amazon’s mission, 2019: “Be Earth’s most consumer-centric company.”
Mission vs. Slogan
State your mission, not your slogan.
- Represents values
- Long-term
- Inspirational
- Represents branding
- Shorter-term
- Catchy
- Youtube’s mission: “Give everyone a voice and show them the world.”
- Youtube’s slogan: “Broadcast yourself.”
Do
- Prefer verbs over nouns. Focus more on what you do than what you are.
- Convey passion.
Don’t
- Don’t use jargon, acronyms, or cliche words like “platform” and “solution”.
- Don’t use superlatives like “best” or “leading”. Every company wants to be the best.
Consider
- Using an X for Y description (“Airbnb for pets”) if it’s accurate and compelling.
- Using a company madlib: “{your company} helps {target customer} {solve problem} with {product}.”
Good Mission Statements
- Uber: “We make transportation as reliable as running water, everywhere, for everyone.”
- Tesla: “We are accelerating the world’s transition to sustainable energy.”
- Square: “We make commerce easy.”
- Able Loans: “We fund the Fortune 5 million.”
Bad Mission Statements
- “We offer highly-customized mobile security, identity management, and cloud-based solutions for enterprises.” (too many buzzwords)
- “The best online platform to upload, edit, store, and share digital images and videos.” (too much detail)
- “Built to last.” (a slogan)
Creating a good mission statement takes time. Practice it on strangers until they nod and smile instead of look confused and excuse themselves to the bathroom.

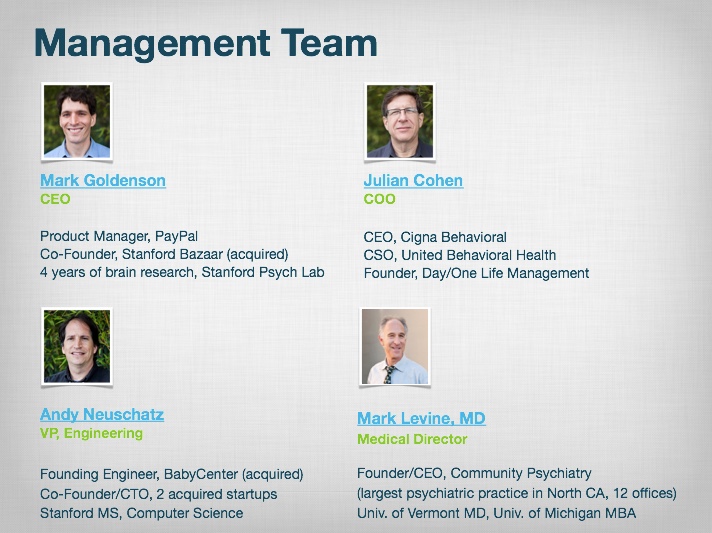
Team
The team slide should excite investors about your key people. Many investors view a startup’s team as its most important asset. Investors get excited about the following backgrounds, roughly in this order:
- Success as a founder / key contributor in a related market
- Success as a founder / key contributor in unrelated markets
- Strong work pedigree
- Strong education pedigree
Team Slide Checklist
- Full names, titles, and photos of the founders
- Previous companies and roles
- A major relevant accomplishment or two
- School and degree, if impressive or relevant
Do
- Highlight if your team has already worked together successfully (“the band is back together”).
- Hyperlink names to LinkedIn profiles.
Don’t
- Don’t list non-founders and advisors unless they are prominent contributors. Investors will focus on the founders and so should you given the limited space.
- Don’t list current investors, defer this to the fundraising slide.
Consider
- Excluding company logos. They are visual but take up space and convey less than accomplishments.
- Showing how many employees you have in each functional area.
The order of your team slide depends on your team’s strength. If they are proven, place your team slide near the beginning to boost credibility of the pitch to follow. If they aren’t, place it near the end and lead with something more exciting like your product or market.

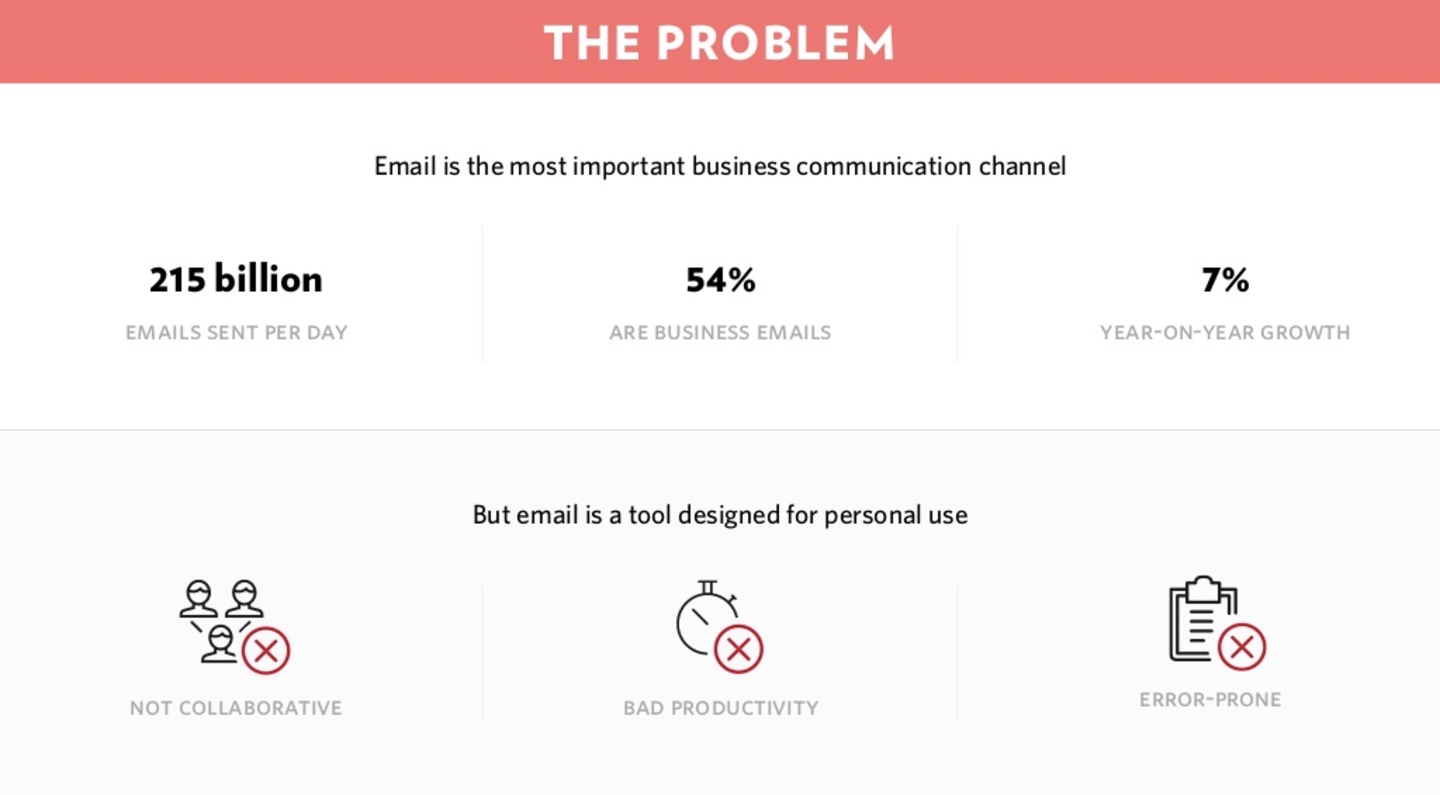
Problem
The problem slide describes who the customers are and what pains they feel.
There are many kinds of pains, like a need for:
- Money
- Sex
- Relationships
- Pleasure
- Status
- Time
- Productivity
- Efficiency
- Quality
- Convenience
- Compliance
- Knowledge
Show how your problem is deep (people really want it fixed) and wide (affects many). Show that you’re creating a painkiller, not a vitamin.
Some pains are subtle, like a desire for individuality or connection. One way to clarify subtle pains is to show how people kluge existing products to fill their needs. For example, many people used Facebook for microposts and sensitive messages before Twitter and Snapchat respectively supported them better.
Explain your unique insight about the problem:
“What I really want to understand is what you know about the problem that everyone else doesn’t. This is usually derived from multiple conversations with customers, deep analysis of current products in the space, and often personal experience… A startup’s unique insight often gives me more of an aha moment than the explanation of what the company does.”
-Michael Siebel, Y Combinator CEO
Problem Insight Examples
- Zenefits’ insight was that they could provide a free HR platform to small businesses by charging service brokers.
- Skype’s insight was that a peer-to-peer network could make any call free, even internationally.
- Twitter’s insight was that constraining posts to 140 characters sparked enormous creativity and real-time information.
Consider telling a story that viscerally illustrates the customer’s pain. For example, HelloSign makes e-signatures easy. The annual number of paper signatures and time spent per signature are important, but illustrating the pain of printing, signing, scanning, faxing, and confirming paper signatures receipt is more compelling.

Solution
The solution slide explains your product or service and its benefits. There are several formats:
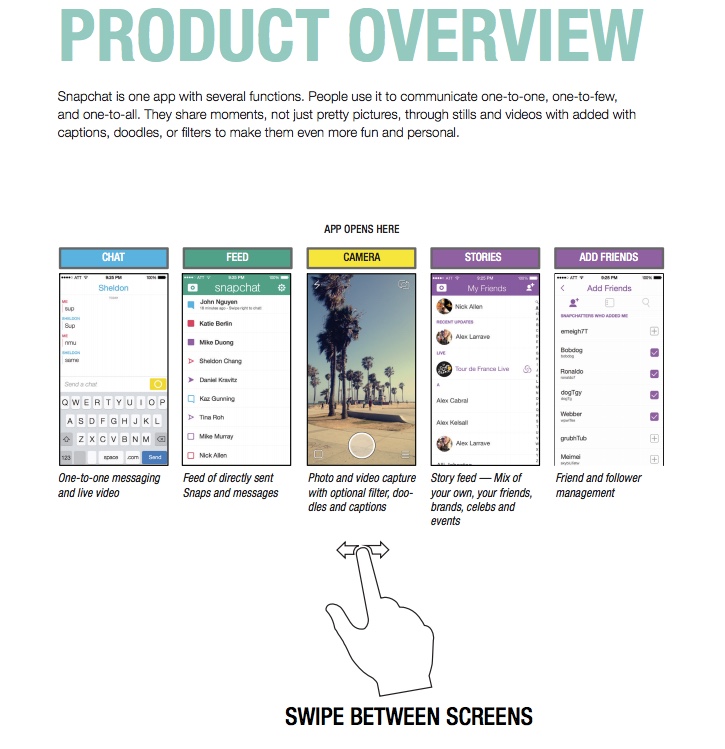
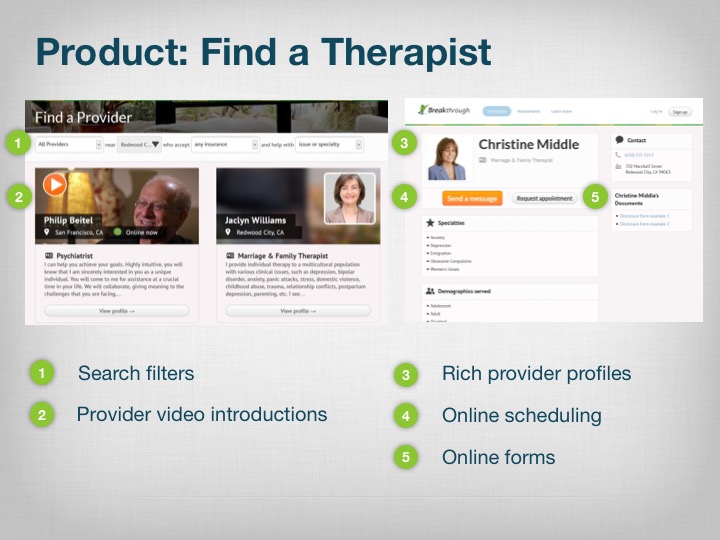
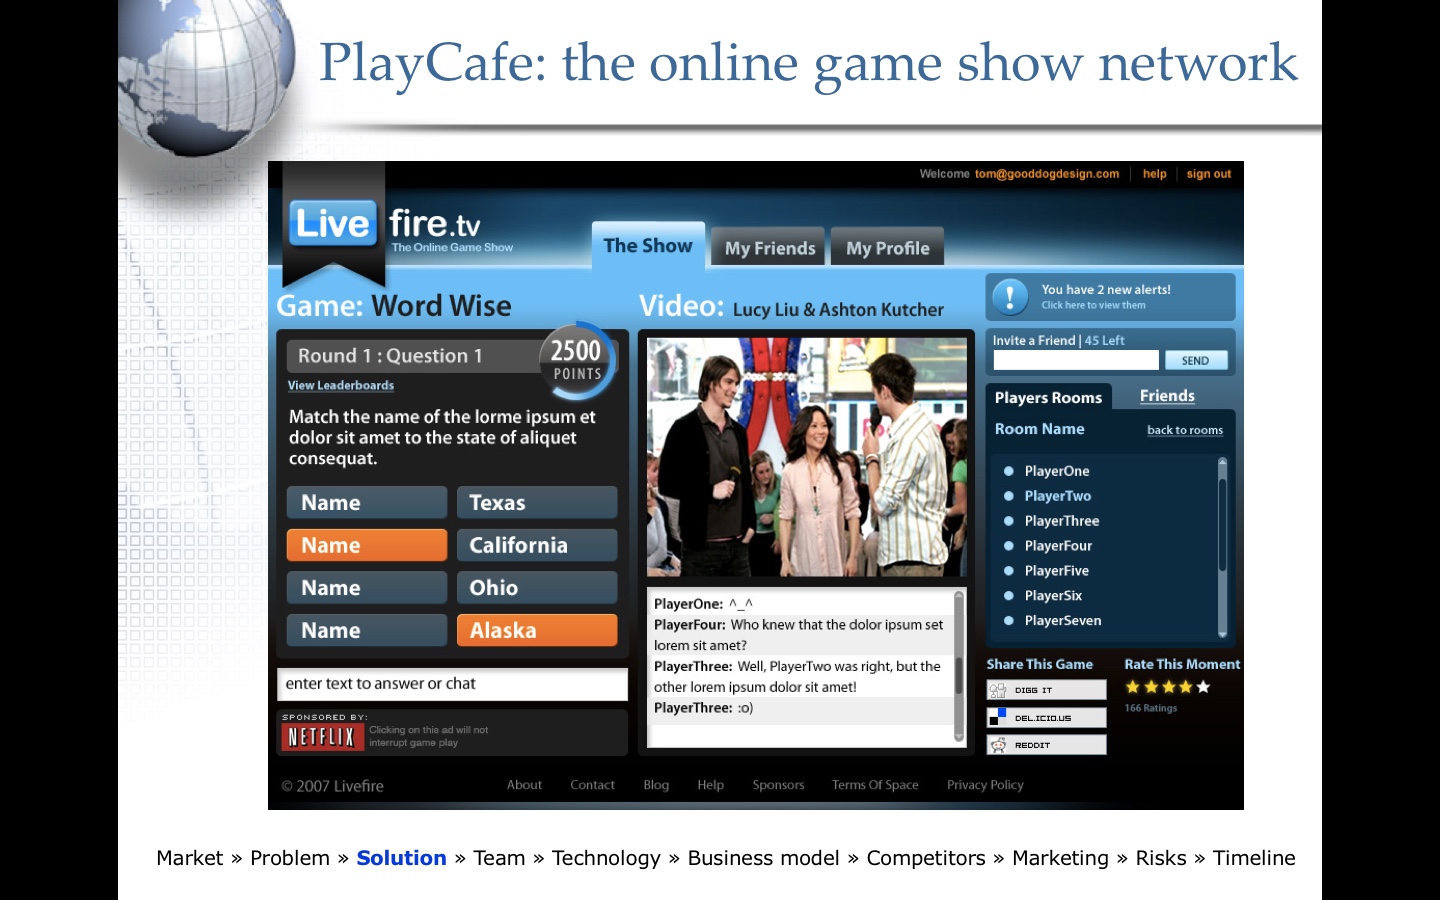
1. Screenshots
For pitch decks read remotely, screenshots are generally best. Use high-resolution images and call out differentiating features. Do not expect people to read 10-point website text; magnify or explain it.
2. A Demo Video
A video can work best when the product is:
- Subtle and clarified by a story (social networks)
- Hardware that’s difficult to demo (drones, medical devices)
- Location-dependent (location-based services, physical stores)
- Requires multiple people to interact (marketplaces, communication platforms)
Twitter’s intro video explains why your mom might use it.
For seed rounds, don’t worry about making the video fancy. Focus on the user’s problem and how you solve it.
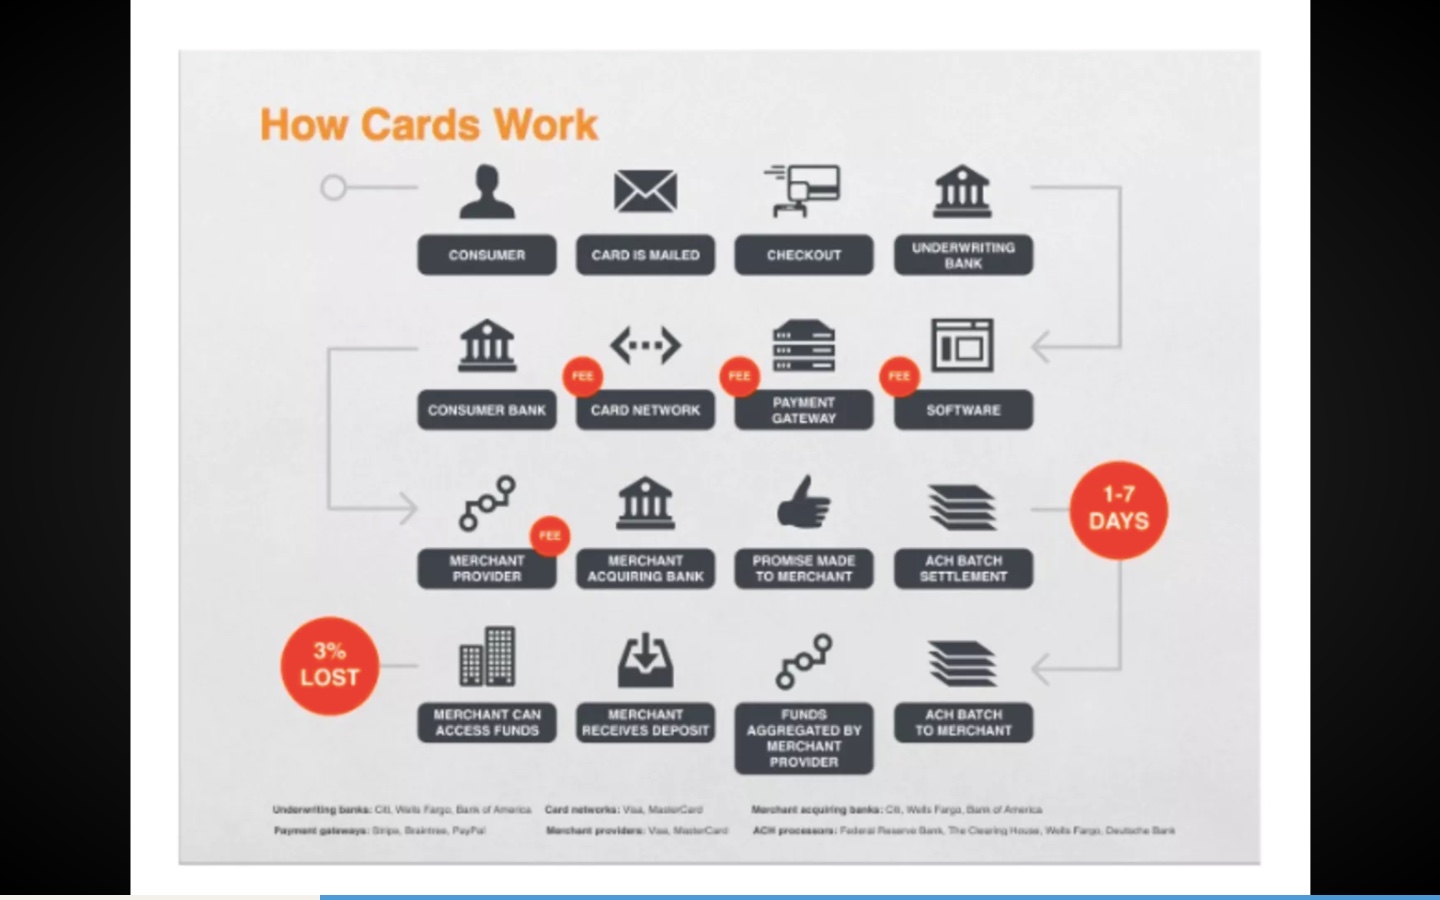
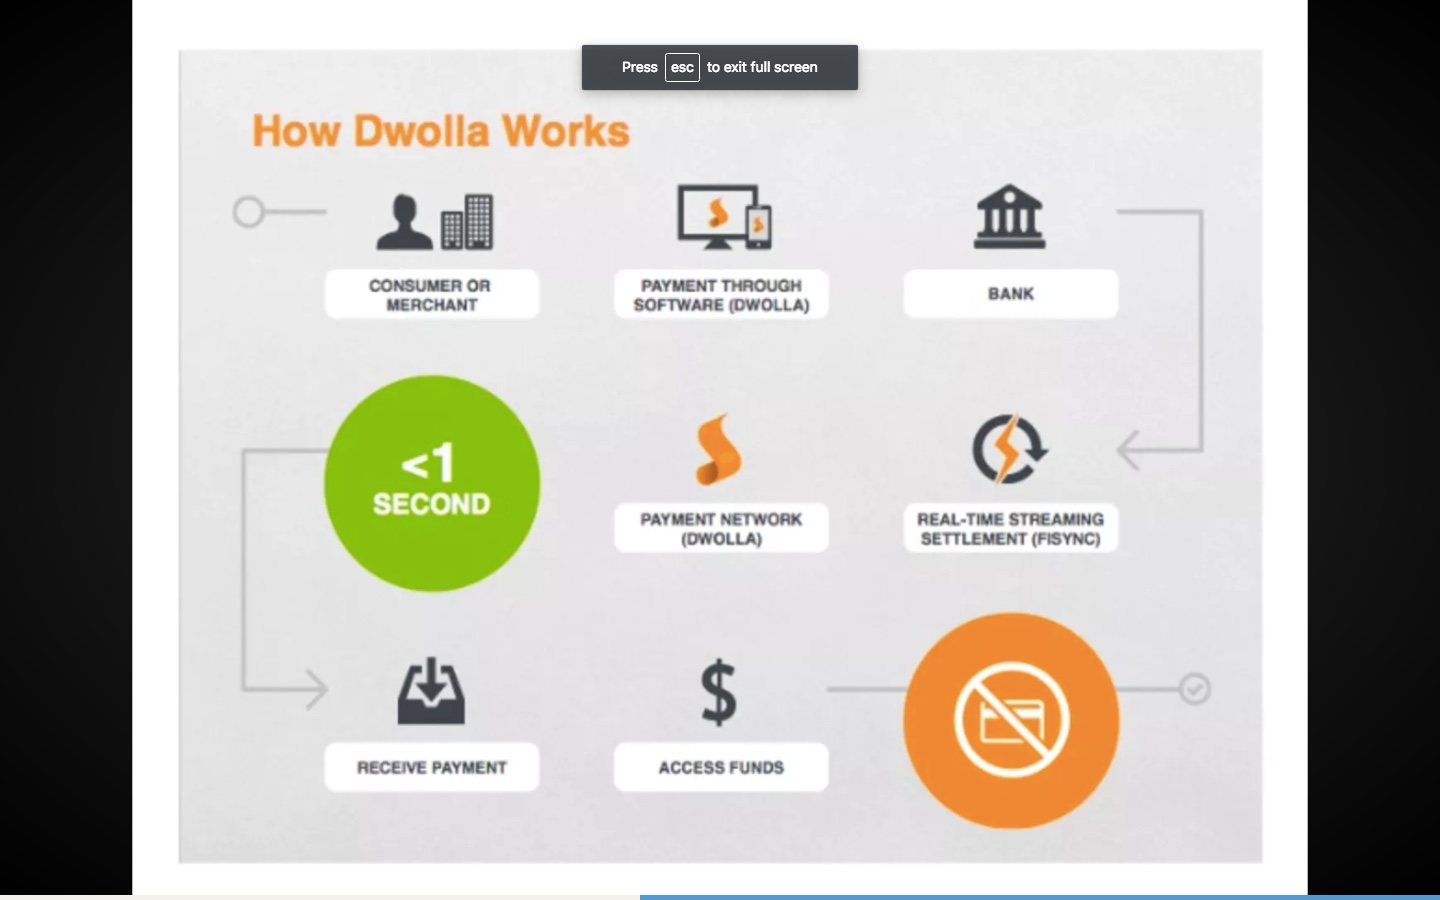
3. Workflow Diagram
If an innovative workflow is a core advantage, a diagram of the actors and their actions can help. Highlight where you add value and exclude irrelevant details.
Market
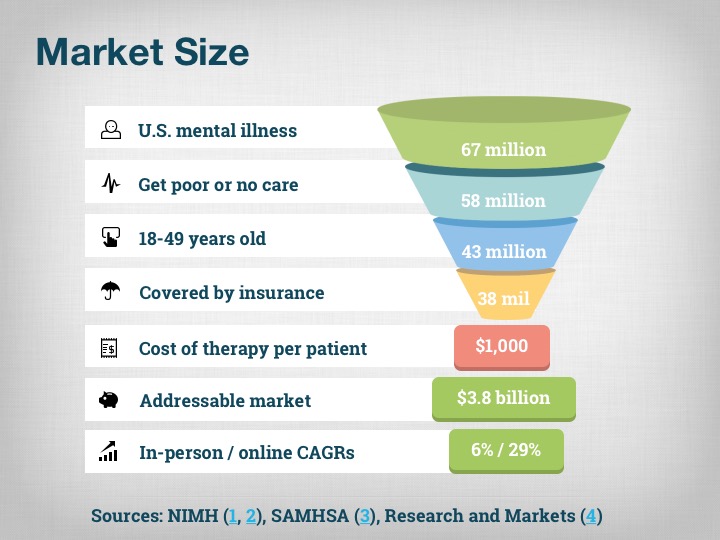
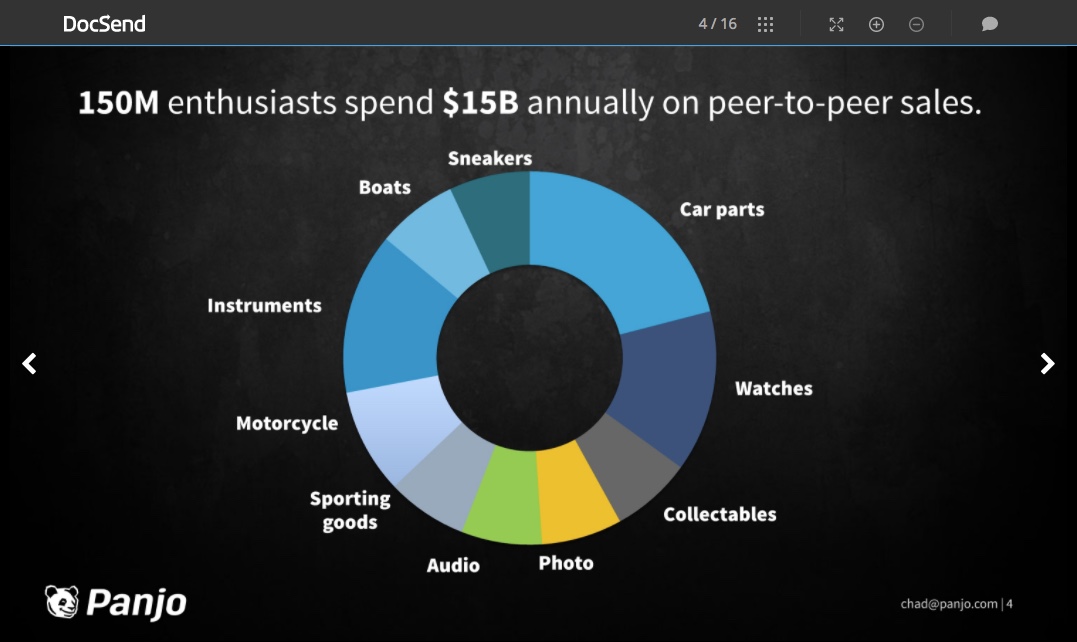
The market slide shows why the problem is lucrative.
Investors like markets that are large, growing, and specific. Use market segmentation to make your market clear and narrow. Markets are layered like onions: broad categories (“enterprise software”, “drones”) with increasingly inner segments (“billing management”, “hand-held UAVs”).
Segmenting your market takes time but you can segment on traits like customer needs, demographics, product features, price, and location. Segments should be large enough to support at least a few competitors.
For existing markets, find market research reports that have already segmented the market. These reports are often expensive but some universities and libraries offer access for free.
It’s tempting to claim you’re in a $10 billion+ market but savvy investors will ding you for being too broad. Narrow your market definition to focus your resources. Most massive companies started narrow: eBay in collectibles, Amazon in textbooks, Google in search, Facebook in colleges.
Once you’ve segmented your market, identify your Total Addressable Market (TAM), Specific Addressable Market (SAM), and Share of Market (SOM).
SOM is hardest to calculate because it’s difficult to know what percent of the market you can capture and how quickly. As an internal reality check, calculate a five-year target of 1%-10% for highly competitive markets and 10%-30% for less competitive or winner-take-all markets, then be pleasantly surprised if you create a monopoly.
But don’t use a top-down analysis where you cite a big TAM from a Gartner report and say you only need 1% of it.
Use a bottom-up analysis from individual customers and transactions. Show how many potential customers exist, how much they individually and collectively spend today (existing market) or will spend (new market), how often they buy, and Compound Annual Growth Rates (CAGRs). Link to credible sources of numbers.
Where there is limited data, talk to potential customers to generate your own. Ask a few dozen in your target market whether they would use/buy your product and ideally get some to buy upfront. You’ll get data for calculating market size and likely other insights.
To reality check your market size calculations, consider doing both a bottom-up analysis and a top-down TAM/SAM/SOM to see if they converge on a ballpark number. When in doubt, go with a bottom-up analysis.
Investors typically look for billion-dollar markets where companies can earn $100M in revenue within 5-7 years. Some unicorns (Airbnb, Snapchat, Uber) created new market categories that can only be credibly sized bottom-up. Ben Horowitz of Andreessen Horowitz jokes that he invests in “tiny markets with no way to monetize”. What he means is markets that are currently undeveloped but potentially explosive.
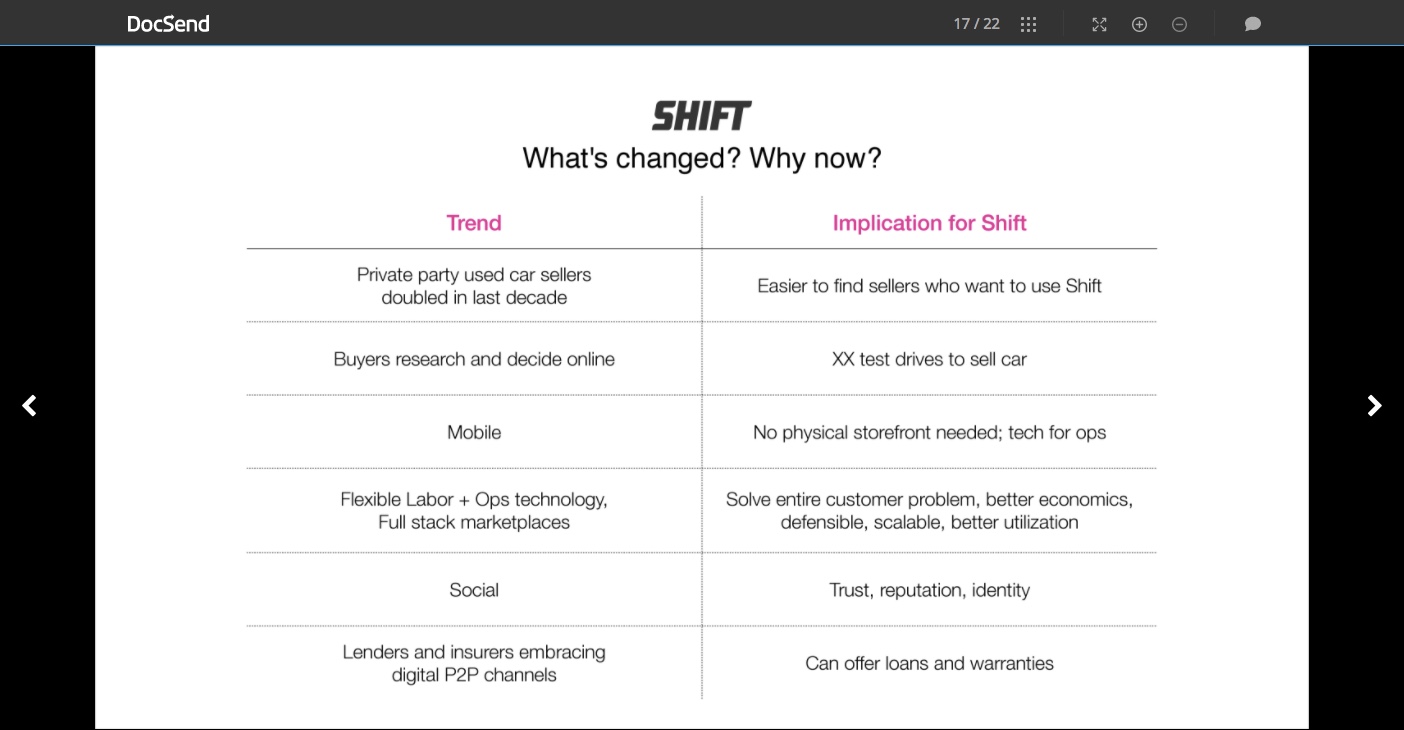
Why Now
The Why Now slide describes the market enablers that make now the right time to pursue the opportunity.
Market timing is underappreciated. Many good teams and ideas have failed because they were either too early or late:
Market Timing Examples
- Pseudo.com launched an online TV network in 1993, but video load times were painfully slow. It raised tens of millions but sold for only $2M. Youtube launched in 2005 and used Flash to compress streams. It was acquired for $1.5 billion twenty months after launch.
- Zynga launched in April 2007, one month before the Facebook platform created a highly viral channel to its games. Zynga went public four years later at a valuation of $7 billion.
- Craigslist launched in 1995 and became one of the first classifieds sites with mass adoption. It has stubbornly resisted innovating but its network effect has suppressed dozens of better products that launched later.
Types of Market Enablers
Technology
- New platforms (VR, AR, drones, bitcoin)
- Cheap bandwidth and storage (Amazon Web Services)
- Free and open source tools (Ruby on Rails, Linux)
- Large, available datasets (ImageNet)
- Automation/artificial intelligence (Tensorflow)
Social trends
- Behavior changes (e.g. social transparency, online dating)
- Demographic changes (baby boomers retiring, milennials rising)
- Economic changes (stagnant wages, gig economy)
- Regulation (HIPAA, online gambling, bitcoin)
- Fads/fashions (electronic dance music, Pokemon Go)
Competitive forces
- Fragmented markets (offline retailers before Amazon, cabs before Uber)
- Stodgy incumbents (car companies before Tesla, hotels before Airbnb)
- Ignored market segments (Whatsapp in the developing world)
Identify and quantify 1-3 trends that help explain why your opportunity is timed correctly. While broad trends like greater internet access are valid, shifts specific to your market are more compelling.
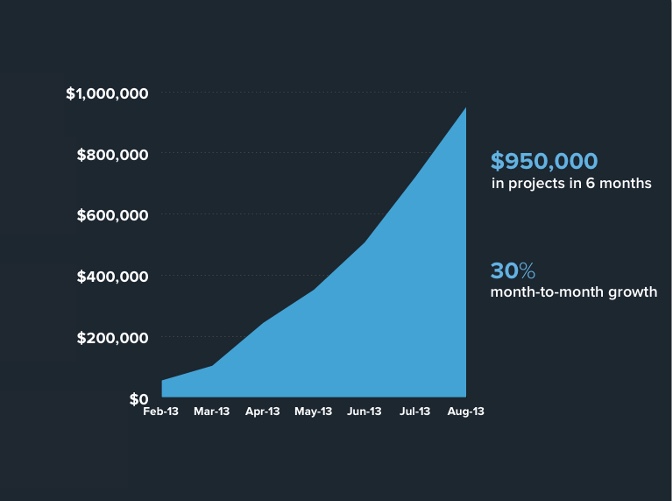
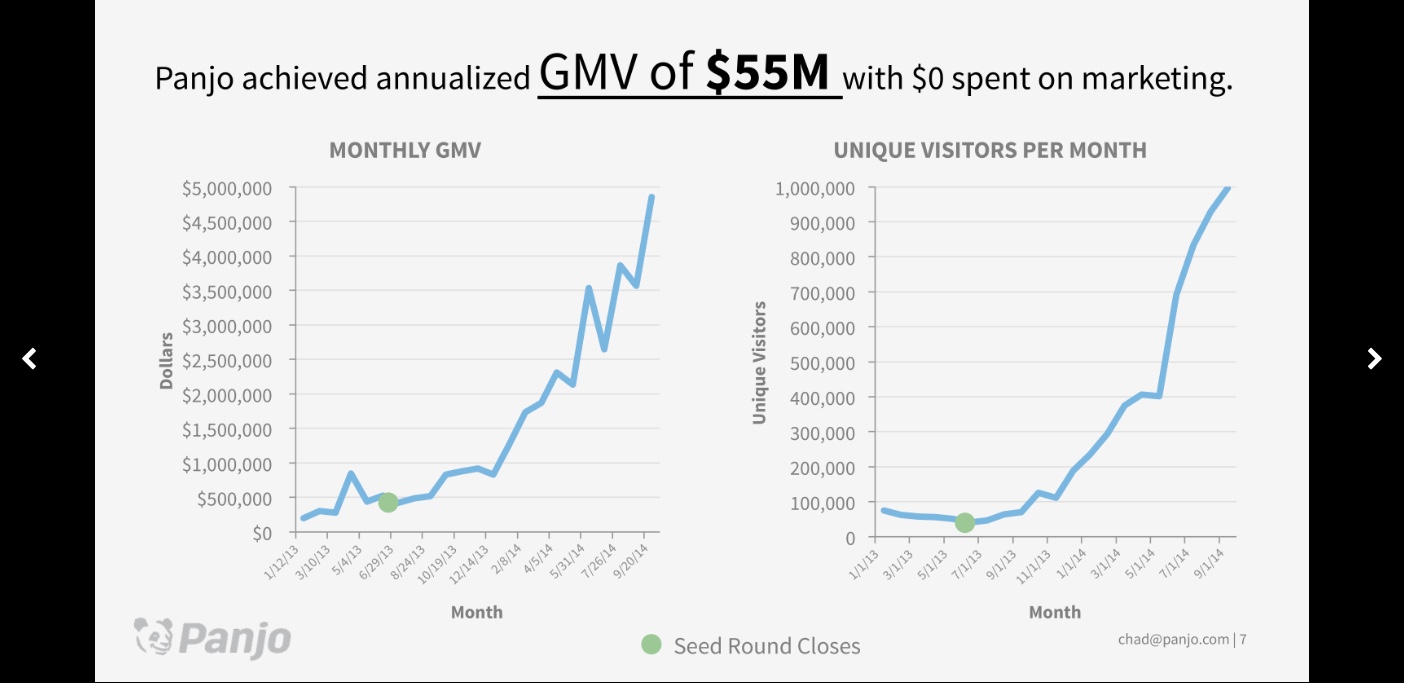
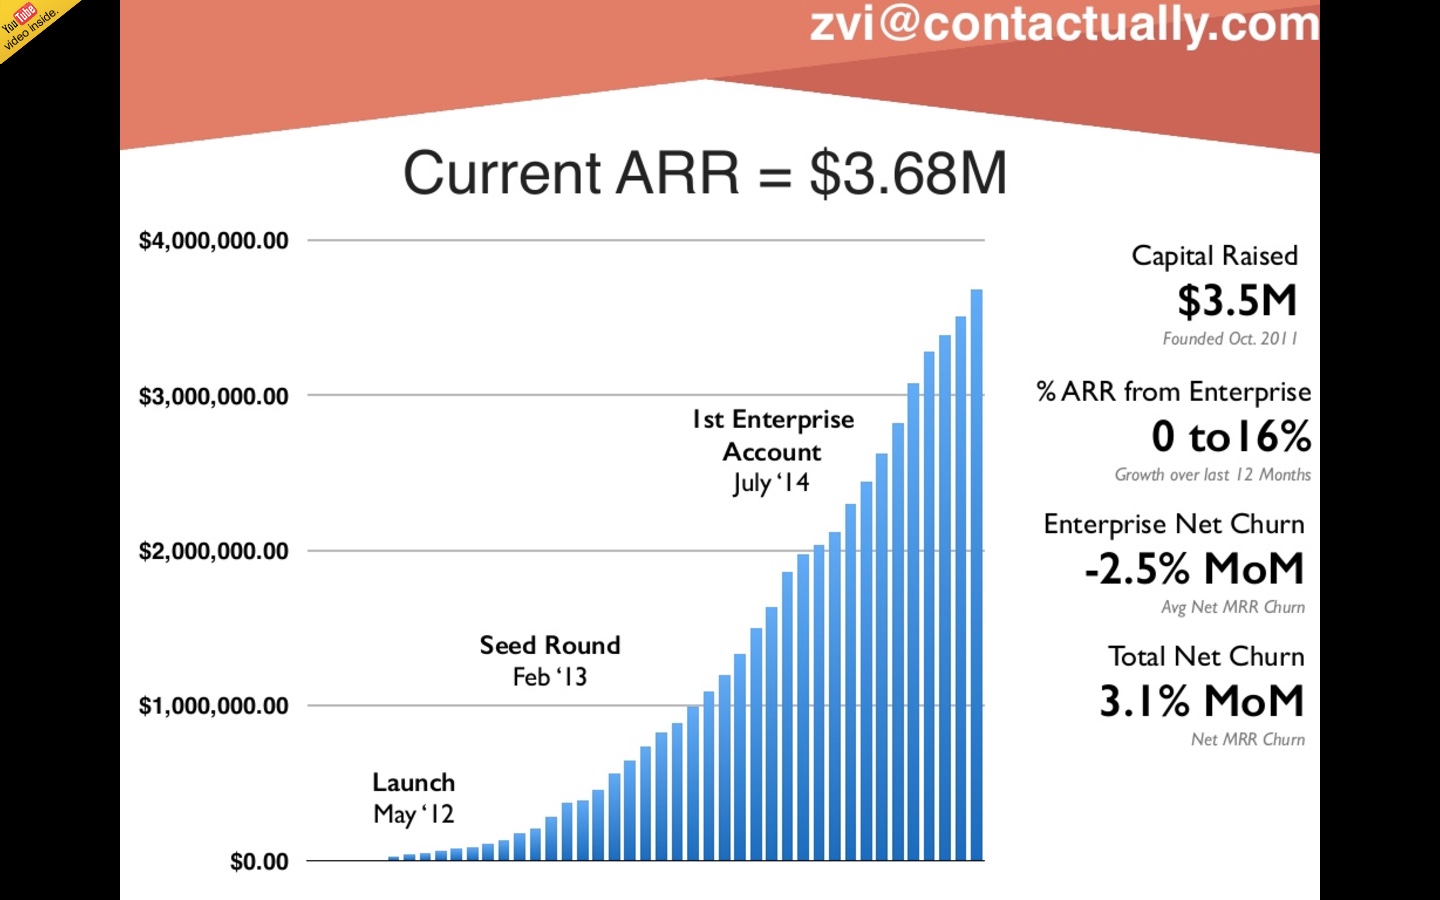
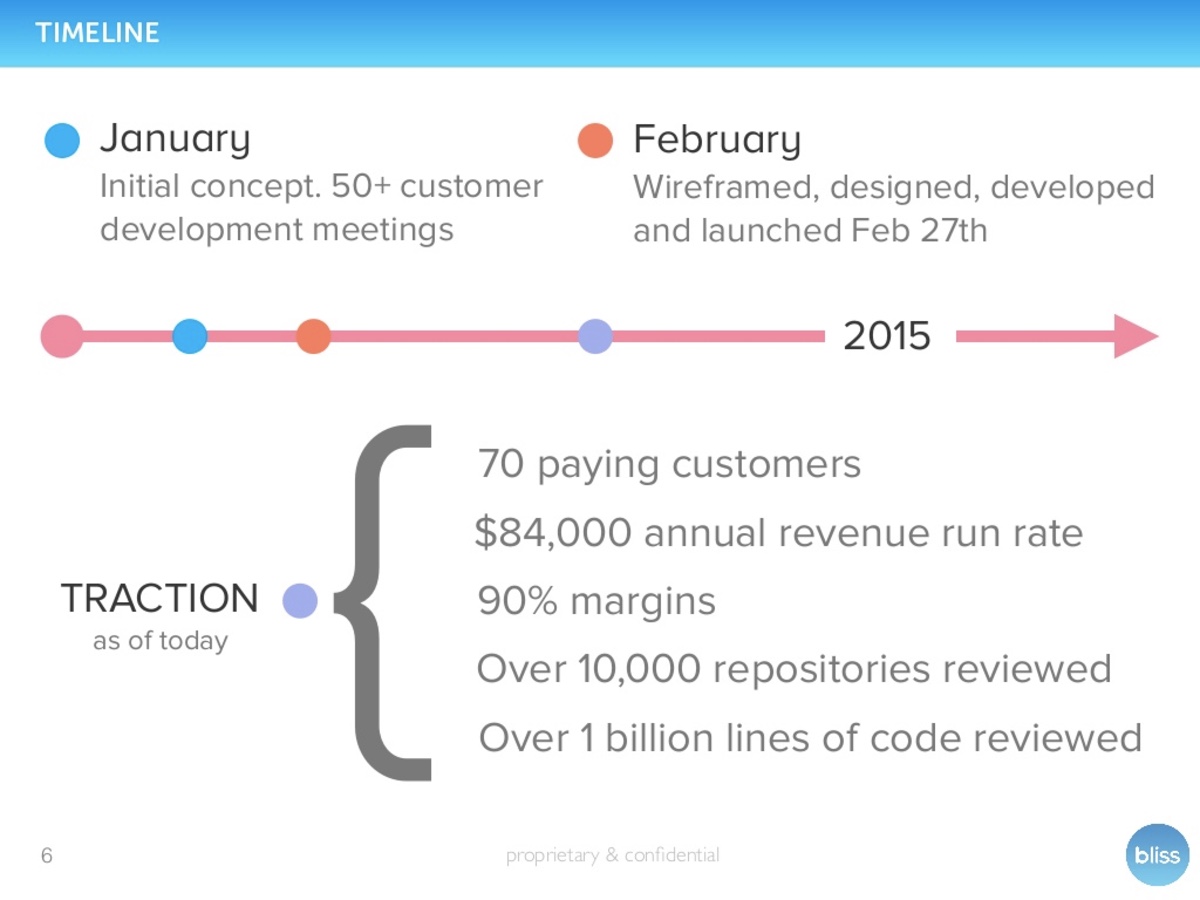
Traction
The traction slide shows your company’s progress and makes the case that you have found product-market fit or validated early hypotheses.
Metrics are usually the most compelling form of traction. Here are some common metrics by company type, though many apply to all types:
B2C (Consumer)
- Unique visitors
- Viral coefficient (k)
- Conversion rate (on signup, purchase, or other meaningful action)
- First week/month-retention %
- CPM (ad revenue per 1,000 ad impressions), CPC (per click), CPA (per action)
- Average time on site
B2B/SaaS (Business)
- Monthly/Annual Recurring Revenue (MRR/ARR)
- Average Revenue Per User (ARPU)
- Cost of Acquisition (CAC)
- Customer Lifetime Value (LTV)
- Gross and net margins
- Payback period
- Average sales cycle length
- Churn %
- Net Promoter Score (NPS)
Mobile
- Daily/monthly installs
- Daily/monthly active users (DAU/MAU)
- Cost Per Install (CPI)
Do
- Prioritize metrics that have grown significantly over time. Nothing quite stokes an investor’s desire to buy low and sell high like a hockey stick graph.
- Label your X- and Y-axes. Hiding axes is evasive and not acceptable in private investor decks (it’s okay in public-facing pitch decks).
Don’t
- Don’t show too many metrics. Just choose 1-3 key ones with the most progress.
- Don’t show vanity metrics like page views or Alexa rank that may sound good but aren’t core to your success.
- Don’t list press coverage as traction. This looks desperate.
- Don’t use testimonials on the traction slide. It’s too easy to cherry pick and anecdotes are not data. You can batch testimonials on a separate slide.
Consider
- Highlighting how many users perform a meaningful action unique to your product, like a tweet (Twitter), snap (Snapchat), or pin (Pinterest).
Other forms of traction beyond metrics include brand-name customers, large partnerships, and patents.
If you are pre-launch and have no traction metrics, either drop this slide or consider a “Target Metrics and Milestones” slide that outlines how you define success and when you expect progress.
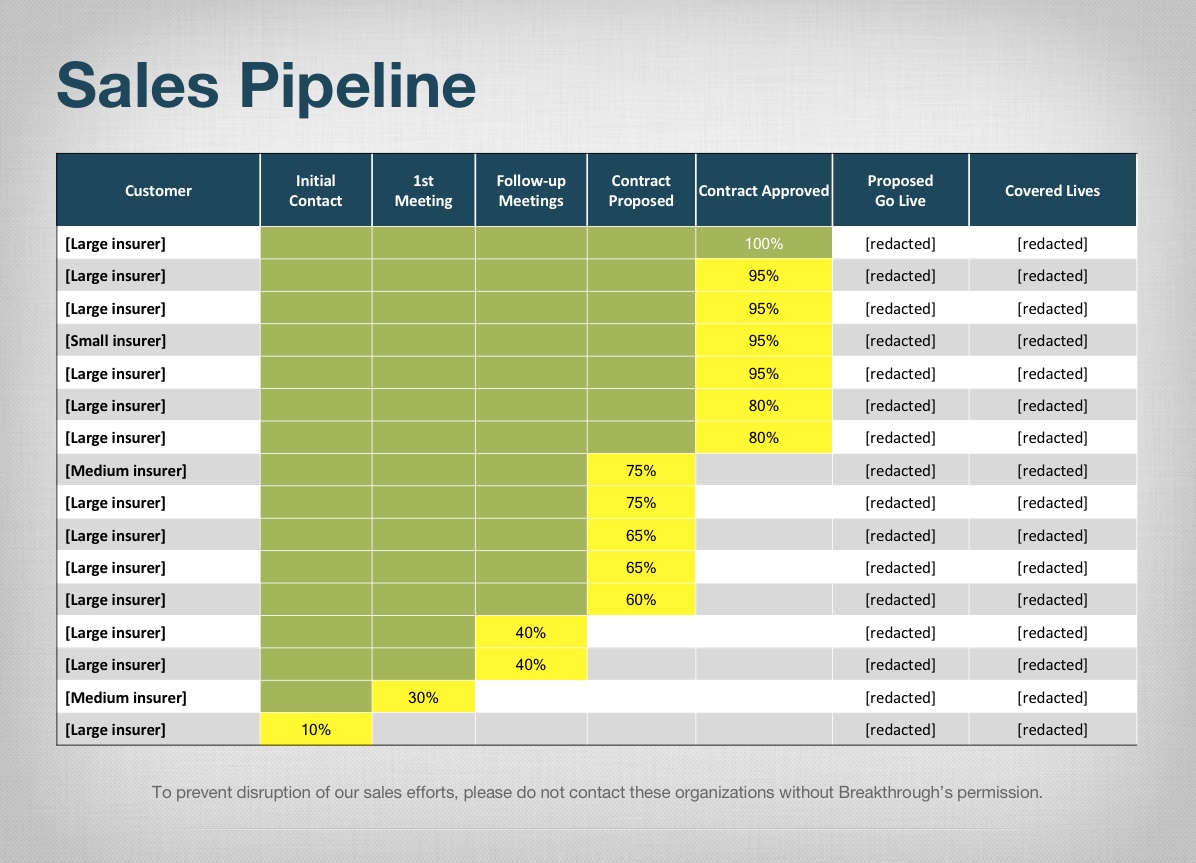
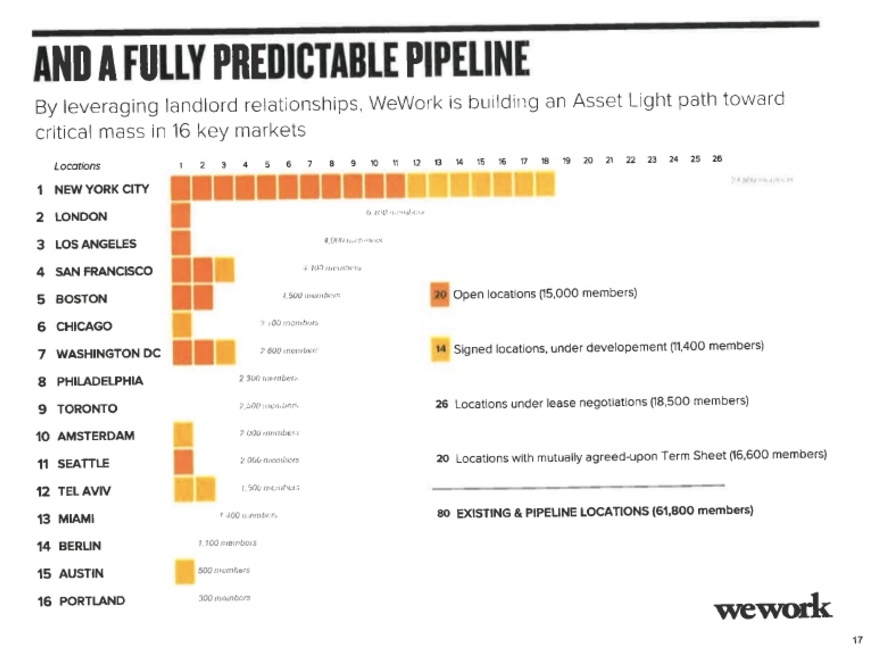
Pipeline
B2B companies that have begun selling should have a second traction slide showing their weighted pipeline. A weighted pipeline forecasts revenue by multiplying the estimated revenue of each sales prospect by its probability of closing.
An unweighted pipeline just lists each prospect’s estimated revenue without accounting for probability of closing. Unweighted pipelines are too rosy and should be avoided.
Map your pipeline stages, which are preferably objective milestones. Customers start as leads, whose interest or ability to buy have not yet been determined, to prospects, whose interest and ability have been qualified, typically by a sales representative. As prospects advance through stages, their probability of closing increases.
Stage Examples
The pipeline structure depends on how potential customers decide to buy and can be designed many ways. Here are some examples and rough probabilities of closing, though they vary greatly by company.
Lead Generation
- First ad impression: <1%
- Outbound contact: <1%
- First conversion (whitepaper downloaded/webinar attended): 2%
- Inbound contact (phone, email, webform): 3%
Lead Qualification
- First meeting: 5%
- Qualified interest & ability to buy: 10%
- Scheduled second meeting: 15%
Engagement
- Showed demo: 20%
- Discussed customization/roadblocks: 30%
- Request For Proposal (RFP)/contract proposal sent: 50%
Closing
- Iterated proposal: 60%
- Finalized pricing: 70%
- Signed contract: 90%
- Revenue closed: 100%
The pipeline should have about 3-6 stages. If you’re using standard pipeline stages like the above, you don’t need to explain them. If your pipeline is unique, show a legend.
Accurately show the stages of your prospects. Series A and later investors often contact prospects (with or without your permission). If a potential investor learns you’ve misrepresented a prospect’s interest, your chance at funding and personal reputation take a serious hit.
If you’re concerned about investors disrupting your prospects, you can redact their names and instead describe their size or industry, but expect to reveal their names before an investment closes.
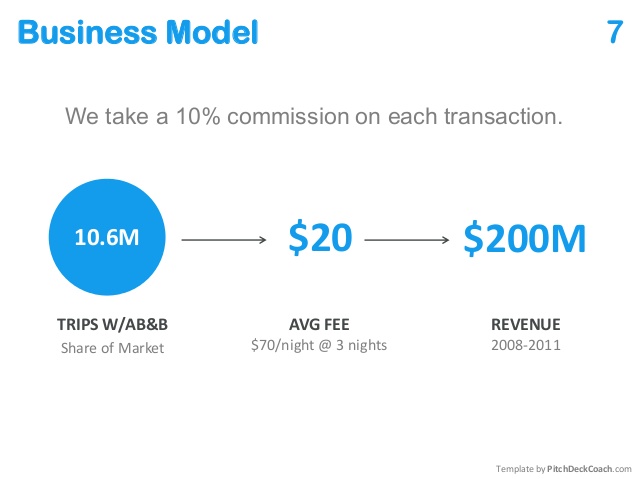
Business model
The business model slide should describe what you sell, who pays you, how much, and how often.
This can include unit economics: the cost, revenue, and profit on each unit of offering. “Business model” is a loose term that sometimes includes strategy and how users are acquired but I prefer to cover the latter in the sales and marketing slide.
Business Model Examples
This Harvard Business Review article lists the below examples.
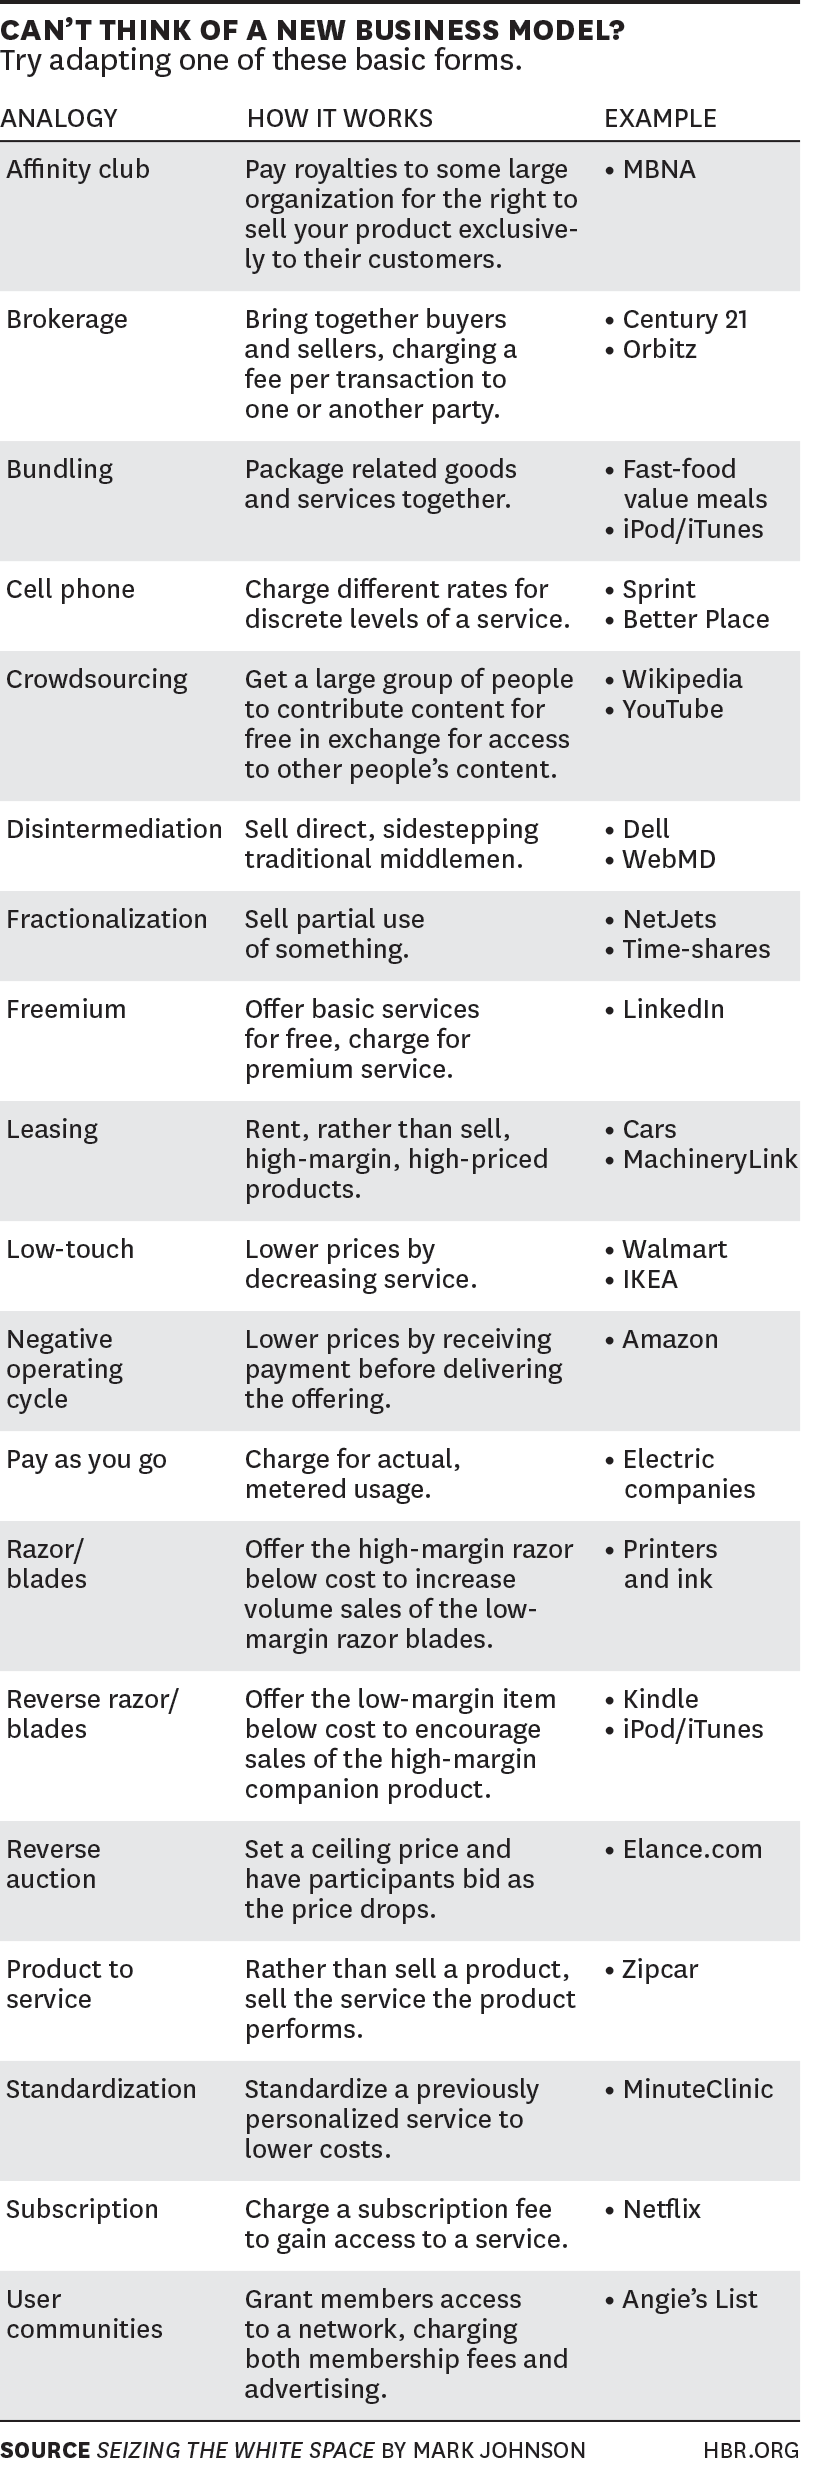
Show actual numbers if you have them or estimated numbers if you don’t. Sell the numbers or sell the dream.
If you don’t yet know your primary business model, commit to testing the most promising one or two. Don’t display a buffet of options.
I like showing customer lifetime value (LTV) and cost of acquisition (CAC) on the same slide to convey profit margin.
When there are multiple parties in a transaction, consider diagramming the flow of dollars, but keep it simple.
The most common startup business models I see are advertising, freemium, subscription, e-commerce, direct sales, marketplace, and pay-as-you-go. Below are data points to consider showing for each.
Advertising
- Type of ad unit: CPM (cost per 1,000 ad impressions), CPC (per click), or CPA (per action, such as a sale)
- Spend / ad unit
- Spend / customer
Freemium and Subscription
- A grid of features for the free plan or trial vs. the paid plan(s)
- Price and period for each paid plan (e.g. $5/month)
- Free-to-paid user conversion rate
- Average subscription term
E-Commerce
- Visitor-to-buyer conversion rate
- Average revenue / transaction
- Average gross margin / transaction
- Average # of transactions / customer / period
Direct (Internal) Sales
- Lead-to-buyer conversion rate
- Average revenue / contract
- Average revenue / sales rep
- Payback period
- Churn rate
Marketplace
- Seller liquidity: the percent of seller listings that lead to a purchase
- Buyer liquidity: the percent of buyer bids that lead to a purchase
- Transaction fee or take rate (% per transaction)
- Listings / seller / period
- Purchases / buyer / period
Pay-As-You-Go
- Unit of purchase (e.g. API query, GB of storage)
- Price / unit
- Price tiers
- Rate caps
- Initiation and termination fees
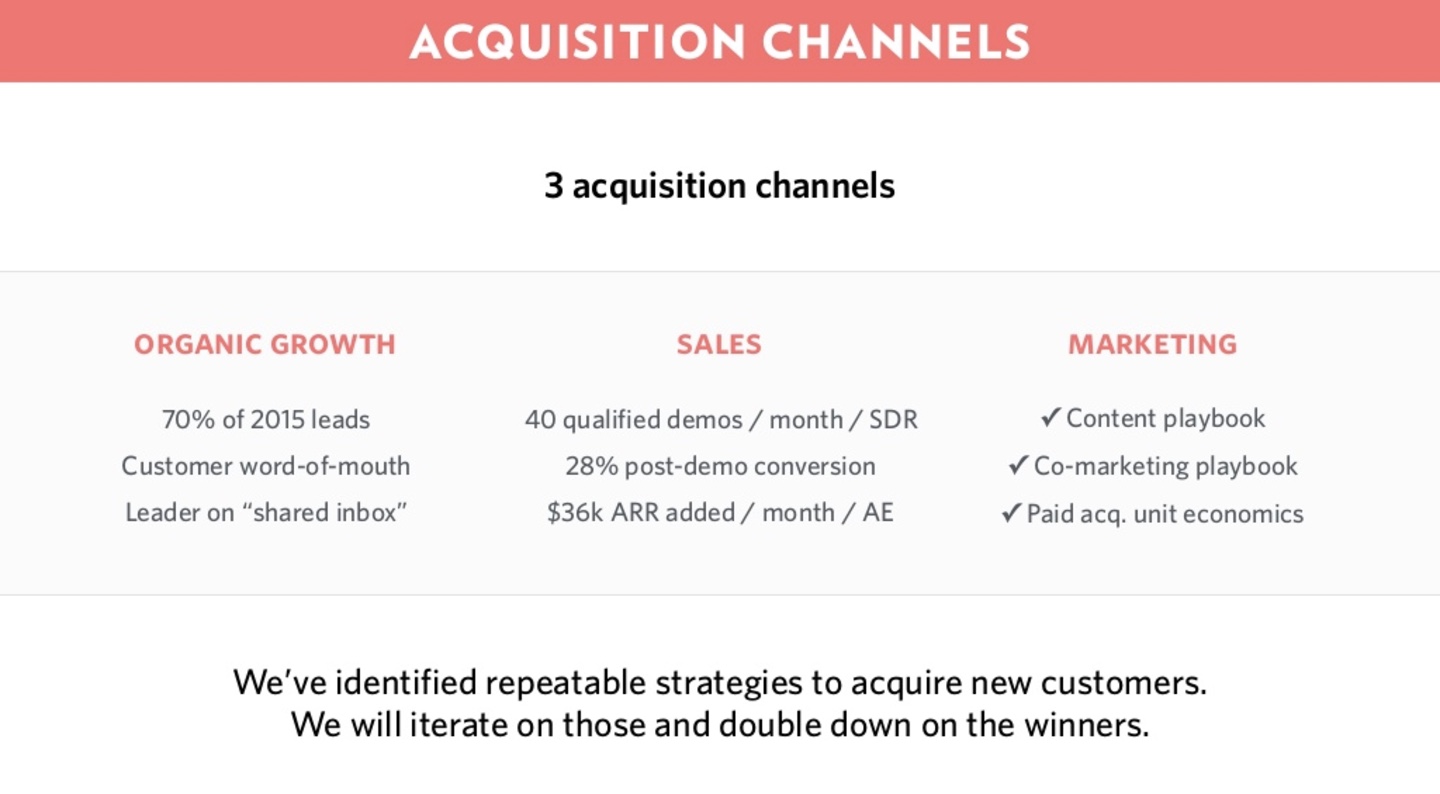
Marketing & Sales
The marketing and sales slide(s) shows how you plan to acquire users and close customers.
I define marketing as how you drive awareness and generate leads while sales is how you turn those leads into customers.
I think these slides are often the most flawed. Many founders do not invest enough time in honing their sales and marketing strategy. The result is often hand-wavey tactics, poor execution, and weak traction, even if the product is good. I believe sales and marketing deserve deep dives.
First, identify your 1-3 marketing strategies.
Marketing Strategies
- Display ads
- Search engine marketing (SEM)
- Search engine optimization (SEO)
- Content marketing (white papers, webinars, newsletters, videos)
- Social media
- User-generated content
- Sponsorships
- Coupons and free trials
- Influencer marketing
- Affiliate marketing
- Viral marketing
- Public relations (PR)
Next, for the methods you choose, focus on:
- Spend per campaign
- Conversion rate (to signups or purchases)
- CAC and LTV
Strongly consider showing a funnel with conversion rates at each step.
I care enough about marketing and sales that I like 2-3 slides on it. The ideal pitch shows a profitable machine for acquiring customers – LTV > CAC – that you just want the investor to fuel.
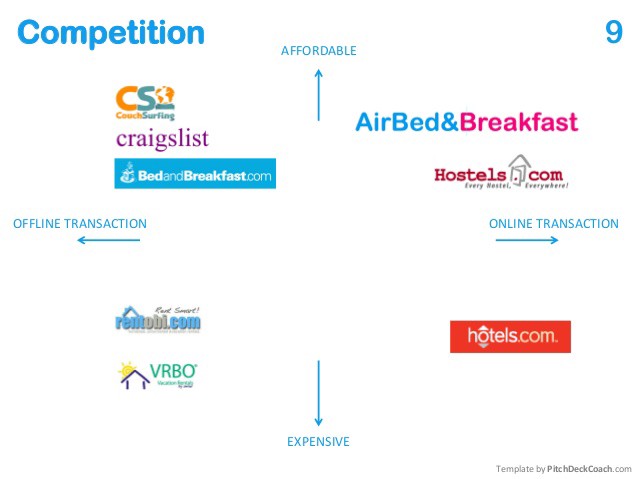
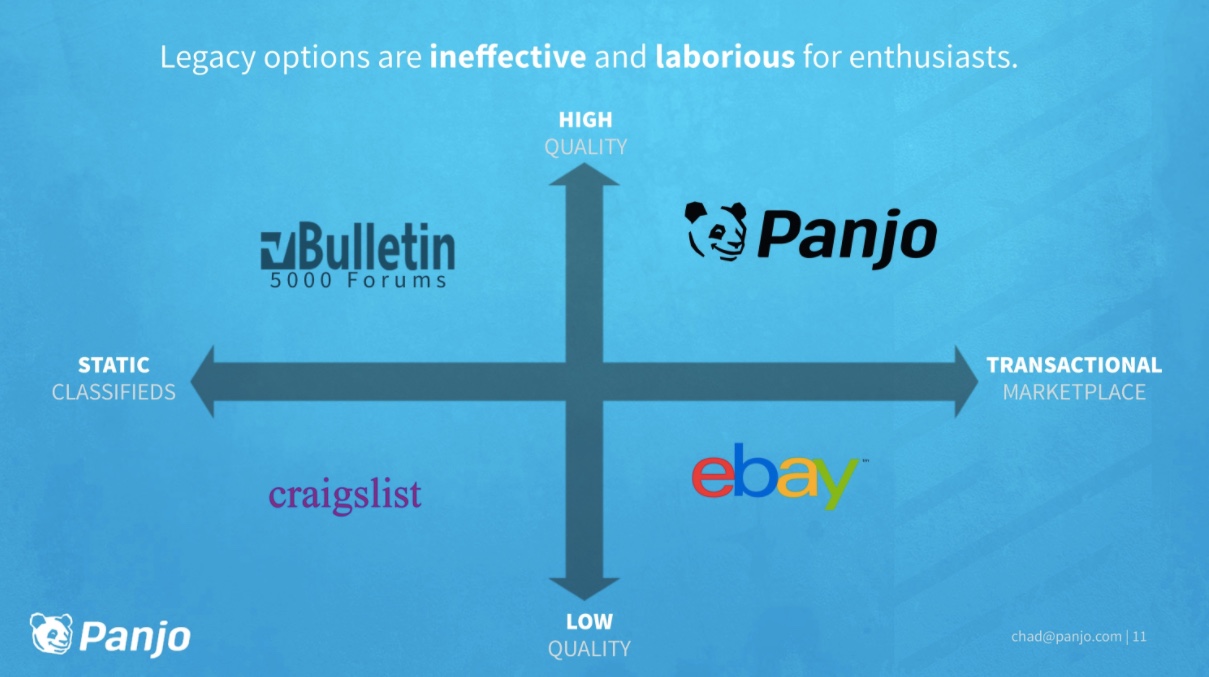
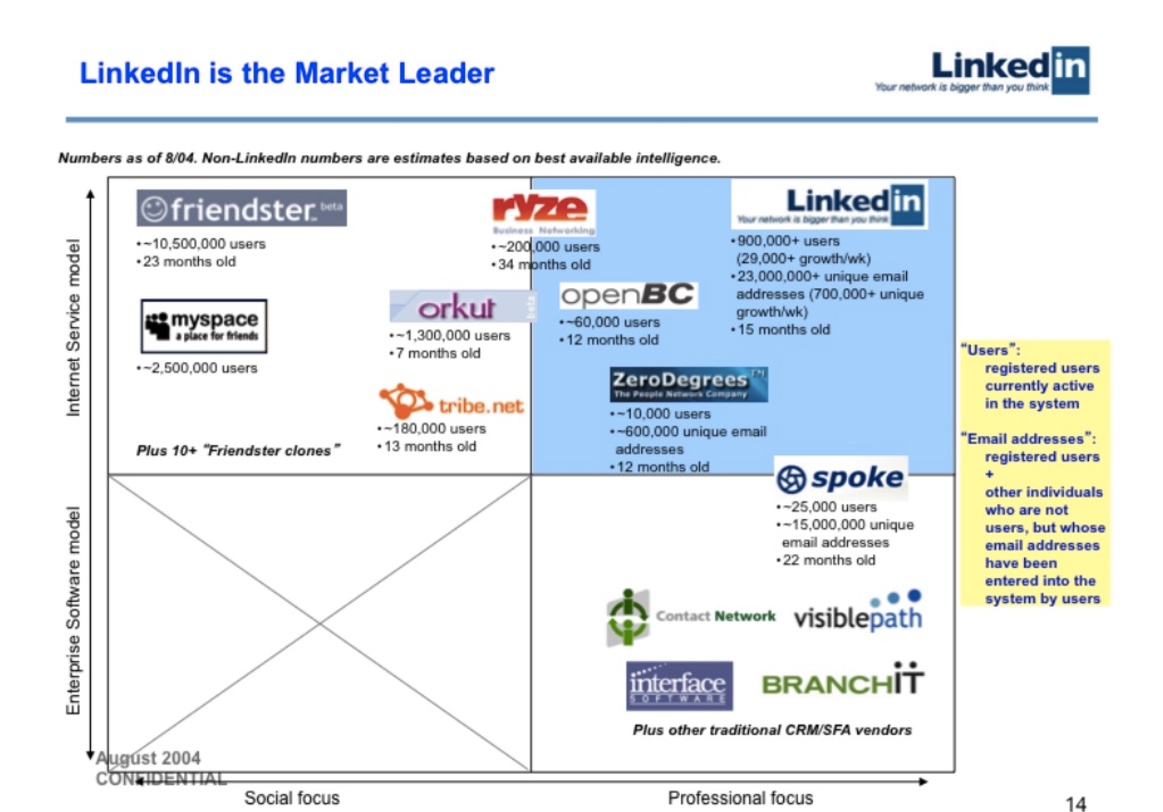
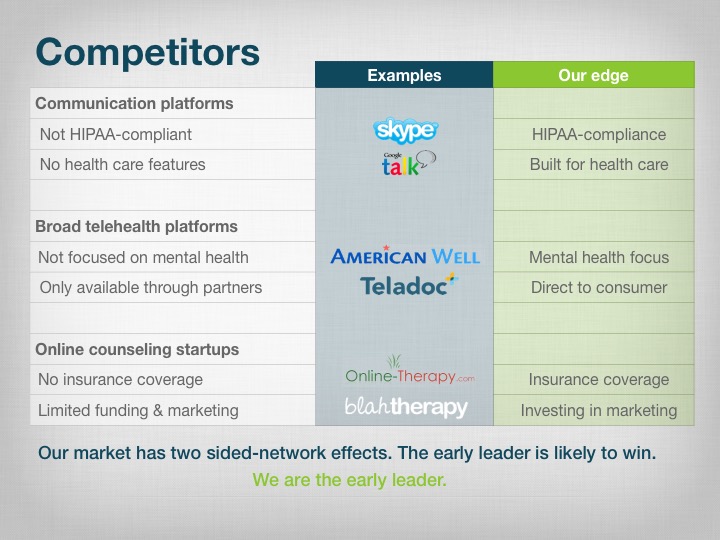
Competition
The competition slide shows your competitors, advantages, and positioning.
First, use your primary market, product, and customers to identify your direct competitors (companies that offer the same type of products and services for your customers’ needs) and indirect competitors/substitutes (companies with different types of products and services that still address your customers’ needs).
For example, Netflix has direct competitors like Hulu and Amazon that offer mass-market video subscriptions, and indirect competitors like TV networks, Youtube, and movie theaters that offer video entertainment. Netflix CEO Reed Hastings has said Netflix even indirectly competes with sleep.
Next, determine your competitive advantages, such as cost, quality, speed, convenience, focus, and brand.
There are a few common ways to present your competition.
1. 2×2 grid
A 2×2 grid uses two traits to segment competitors into four quadrants.
2. Matrix
A matrix uses rows and columns to compare yourself to competitors. The rows can be features, price points, or traits like convenience and speed.
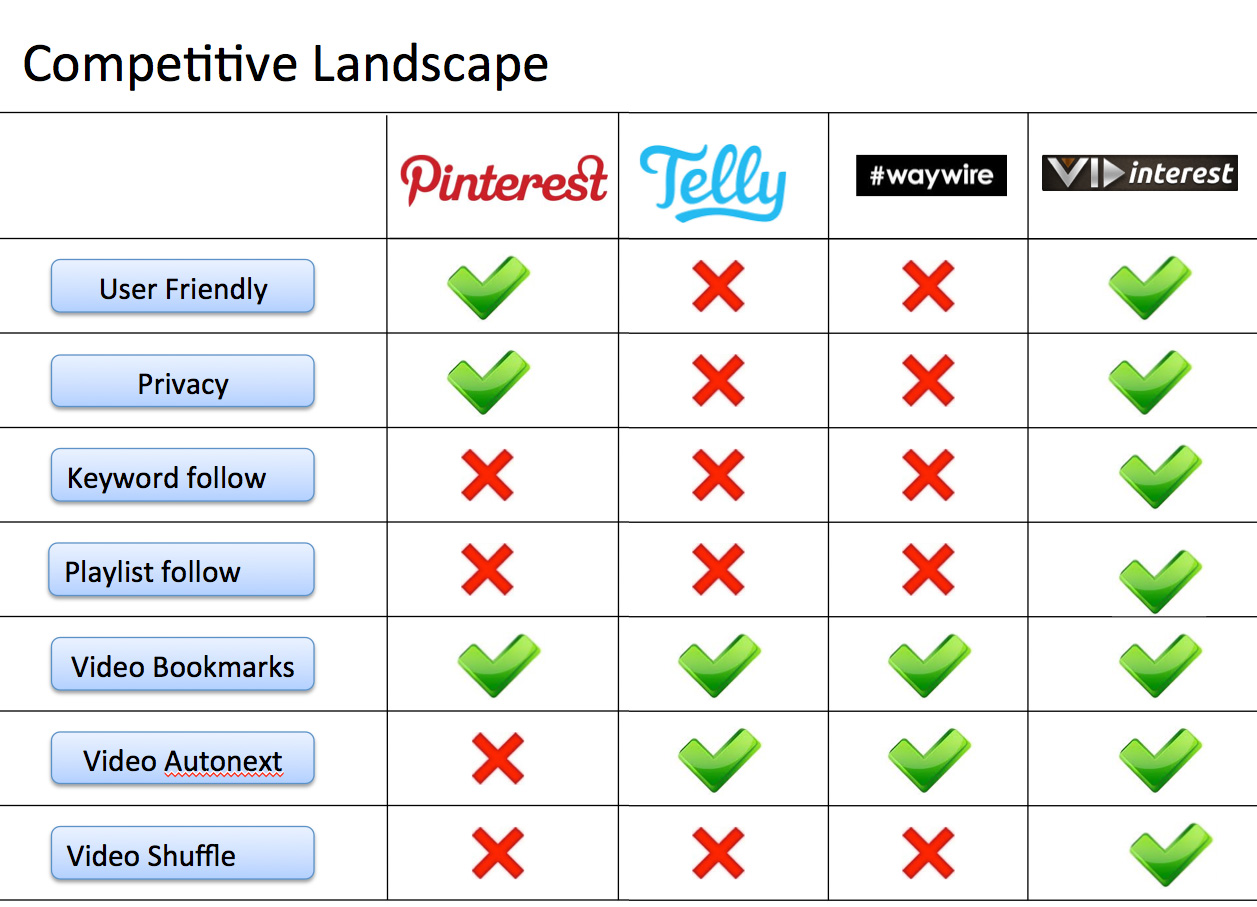
Limit yourself to 5 rows and columns at most for clarity. Don’t mention features that a competitor can build in a few weeks. Focus on advantages that are hard to copy.
3. Harvey Balls
Harvey balls quantify how much a company meets certain criteria with colored circles. They’re famously used by Consumer Reports to rate products.
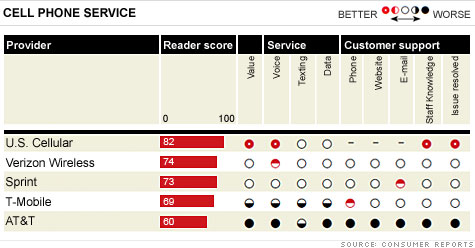
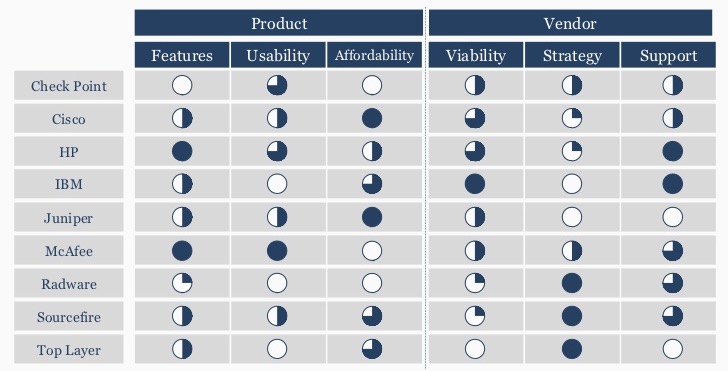
Harvey balls convey the size of a company’s advantages but this is often information overload.
4. Petal
Steve Blank’s petal design shows how a company is resegmenting existing markets. It places your company at the center and competitors on overlapping petals.
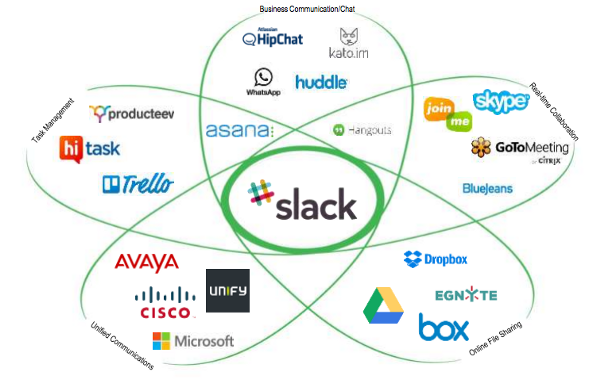
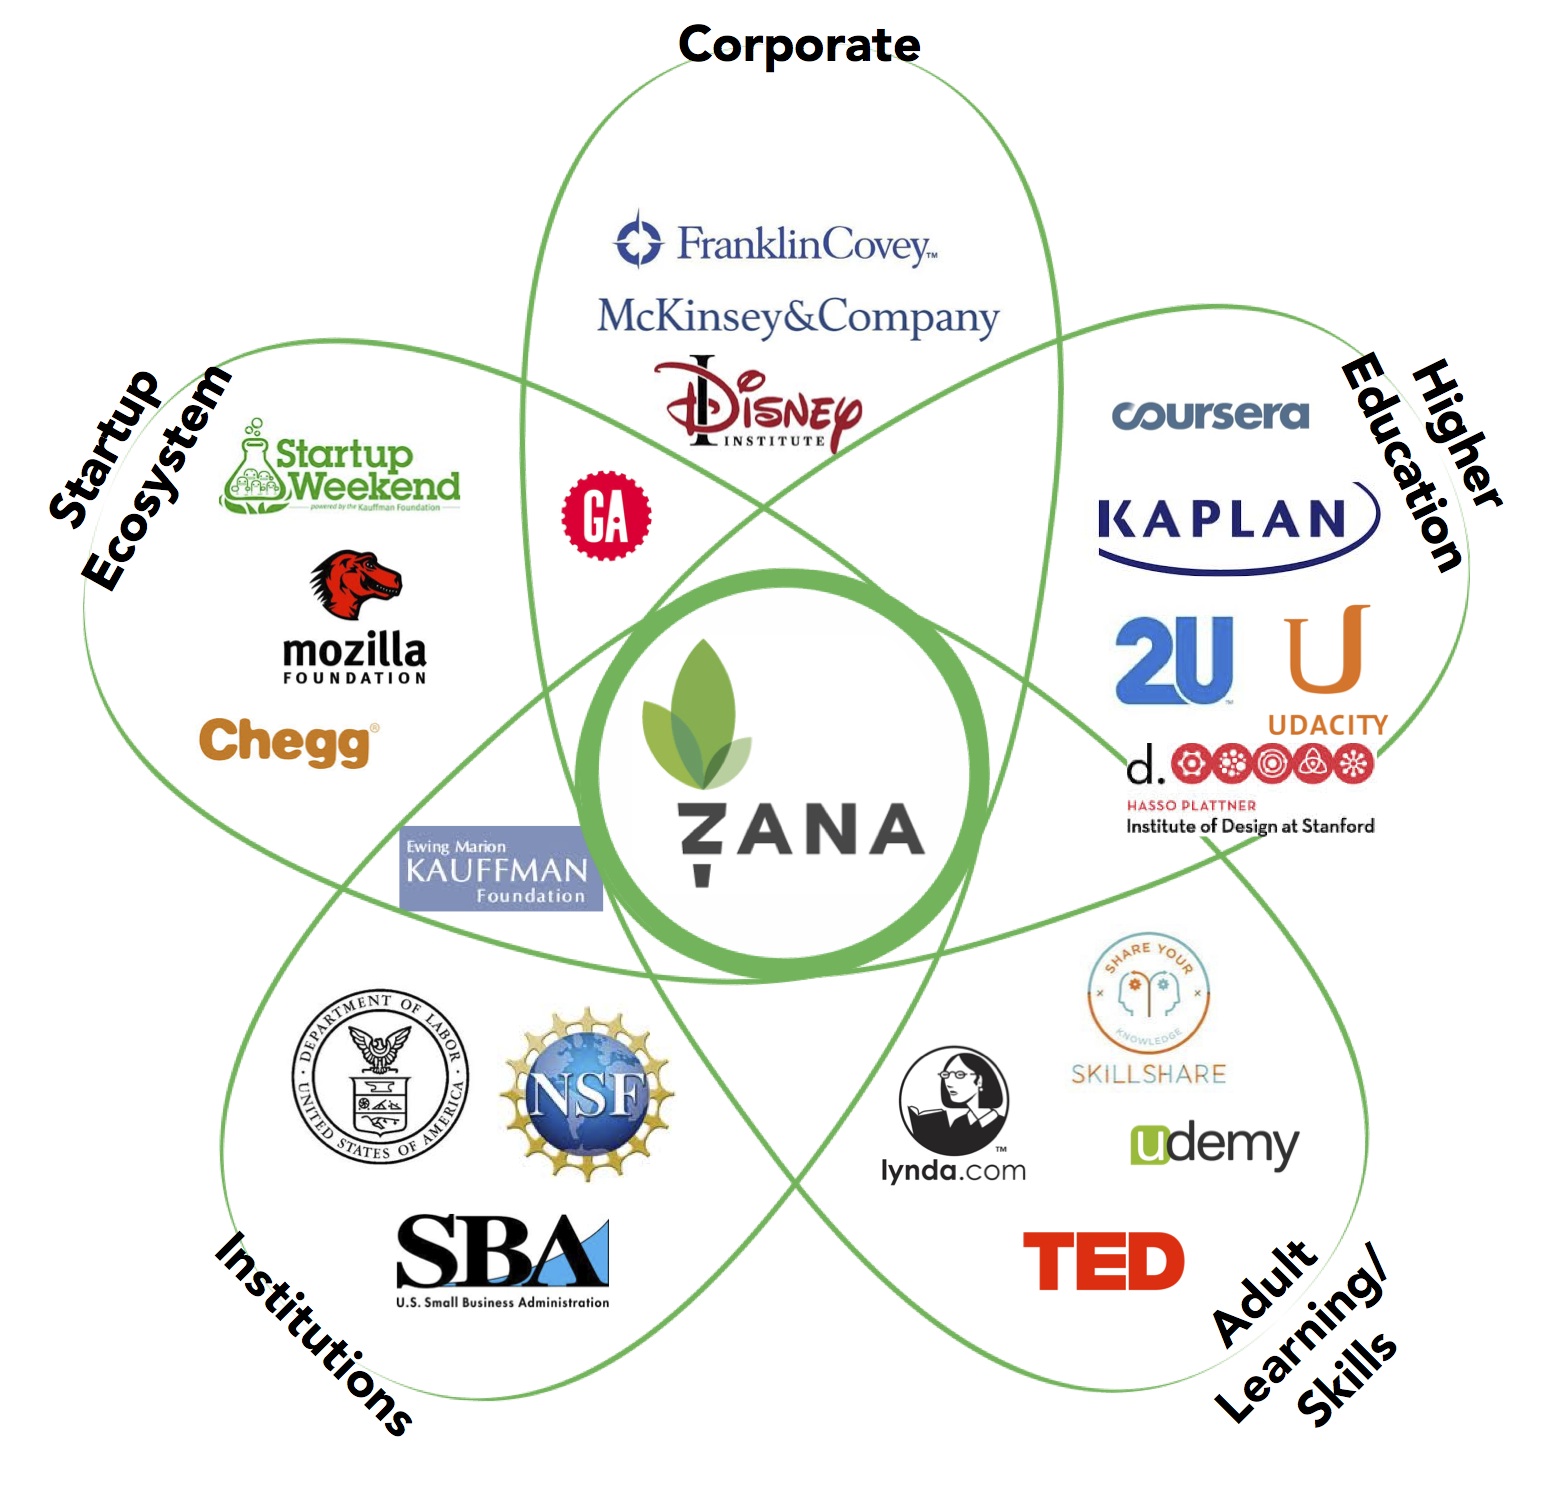
A petal makes sense when you are creating a new type of product with few direct competitors that will acquire most of its customers from indirect competitors. You can show fewer than five petals but avoid using more.
For whatever competition layout you choose, respect competitors and evaluate them honestly.
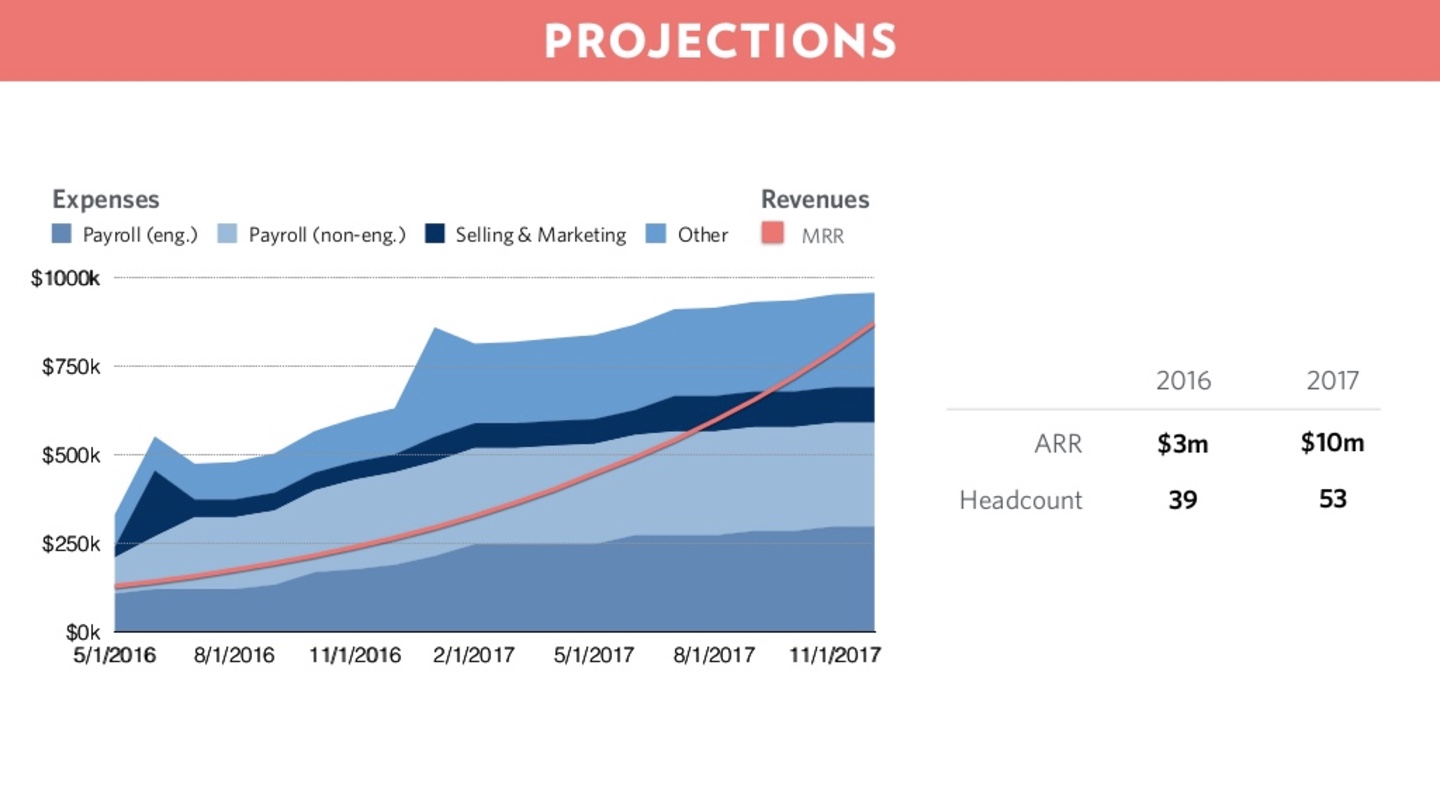
Financials
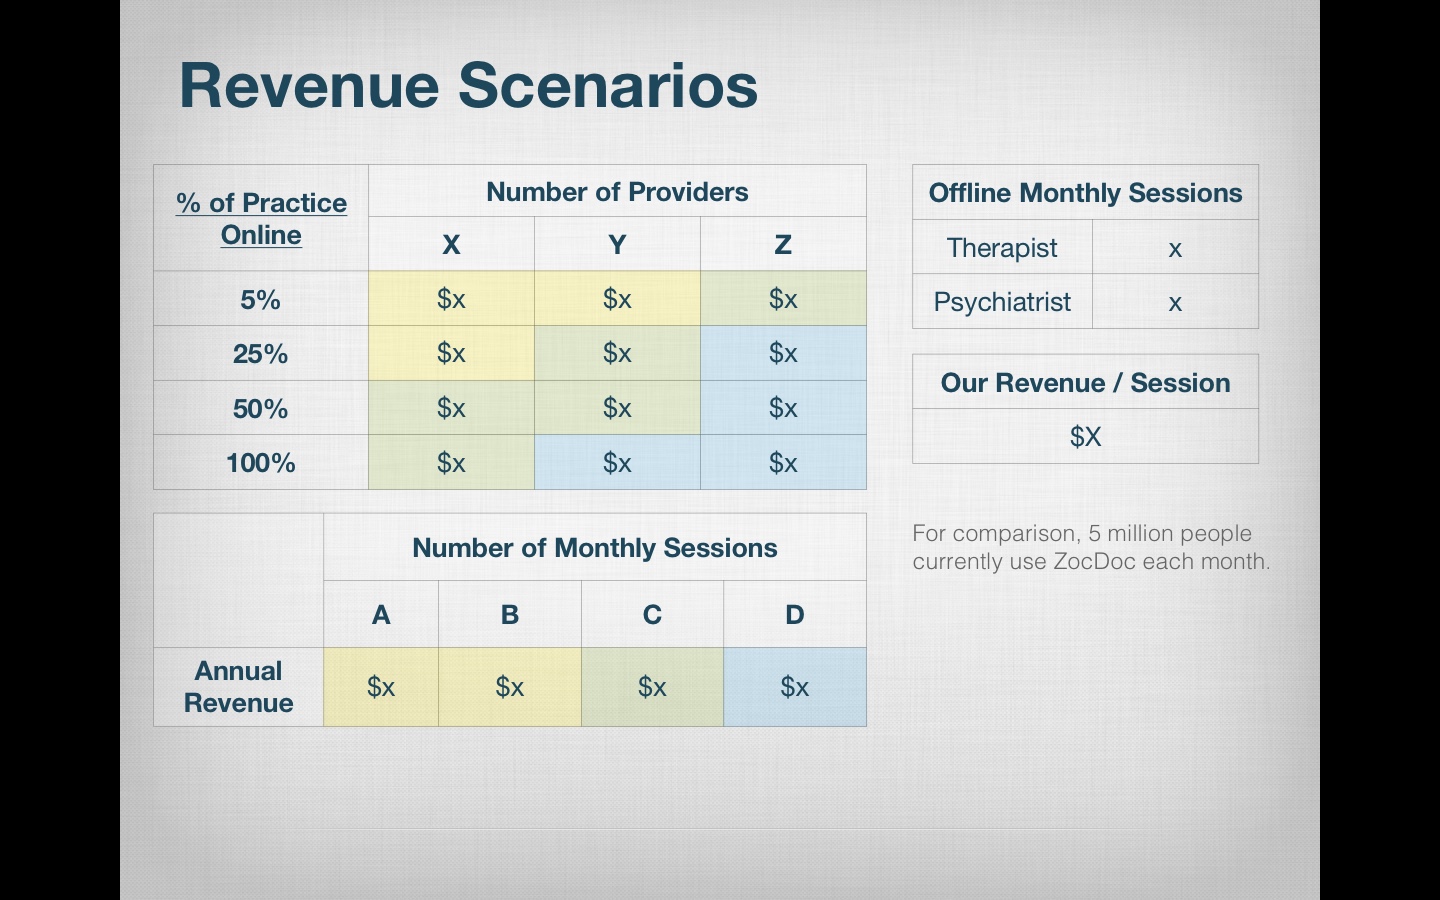
The financials slide shows your key financial metrics or projections.
(Creating a financial model is beyond the scope of this article but I’ll cover how to pitch one.)
DocSend’s analysis of 200 pitch decks found that only about half had a financials slide. Seed startups sometimes omit financial projections on the rationale that they don’t know enough yet, but always build at least a simple financial model. The goal is less to predict outcomes in five years and more to explore assumptions:
- What could be the unit economics?
- What could be the biggest drivers of costs and revenues?
- What price points make the business work at different adoption rates?
- How much funding could be needed to reach breakeven?
A model built in a few days can save founders years of wasted effort. It’s malpractice to not build one.
However, five-year financial projections can be overkill early on and are ill-suited for the small space of a slide. While showing you’ve done your homework is good, copying and pasting projections without explanation forces the investor to decode them. Few will.
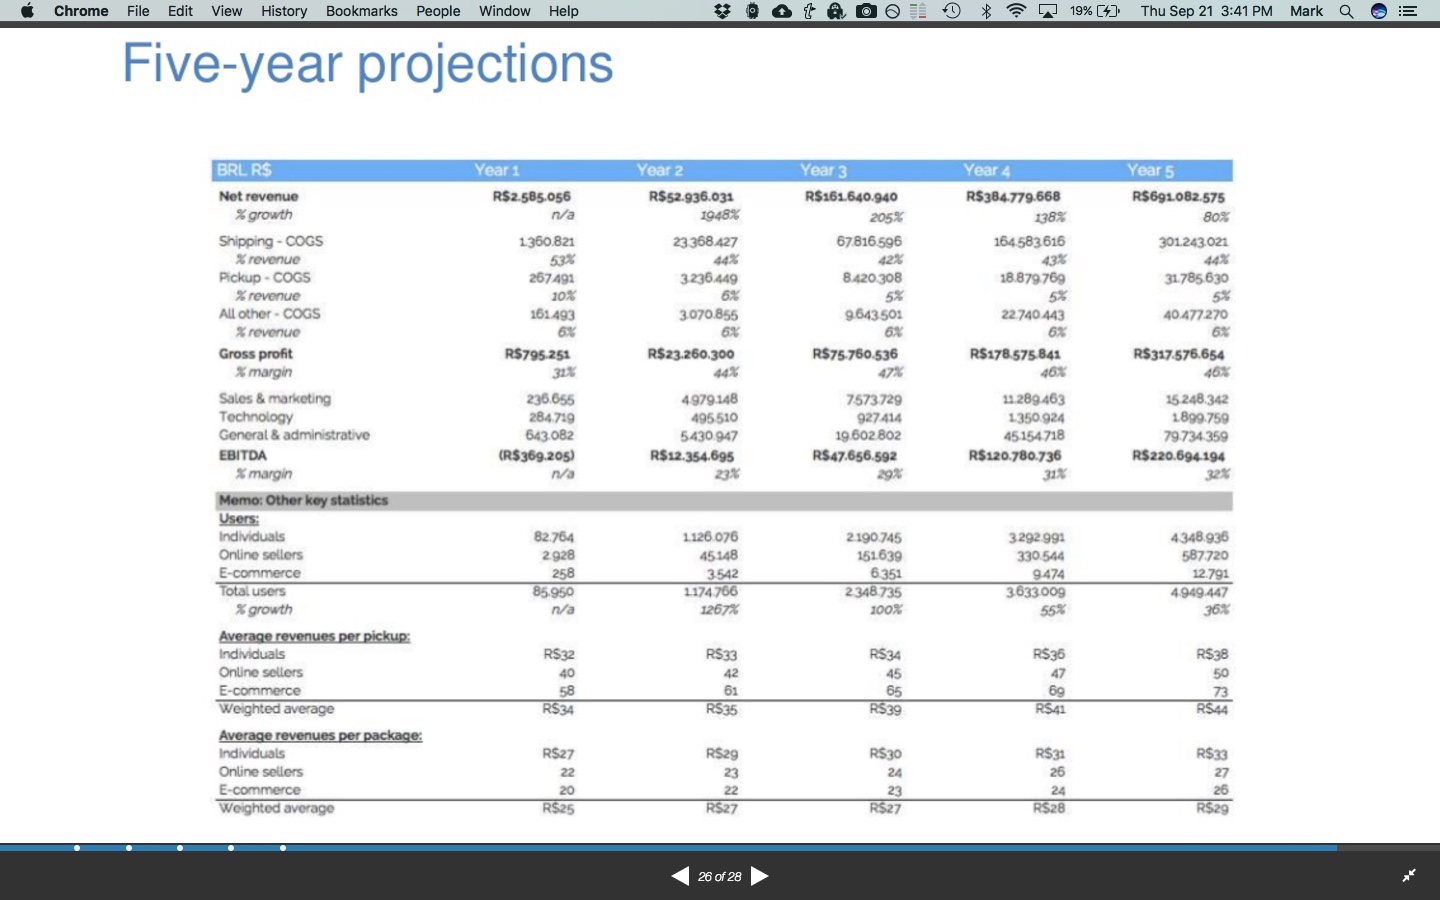
- Your unit economics
- CAC and LTV
- Sensitive levers that make or break your model, like conversion rates, transaction fees, and scaling costs
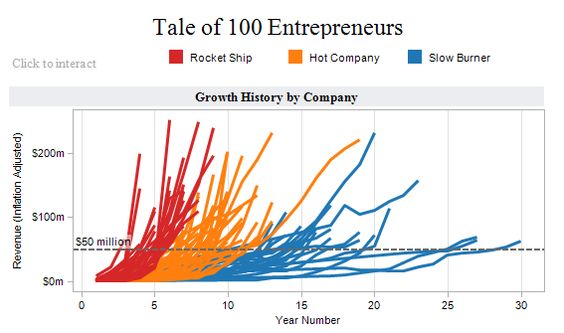
Beware that many investors look for $100 million in revenue by year 5. To show you how rare that is, here’s a 2009 Wall Street Journal analysis of revenue growth at the 100 largest most valuable public software companies.
The average time to $50 million in revenue was eight years. Only 28% had $50 million within six years. That’s how long it took Microsoft. It took Oracle ten years.
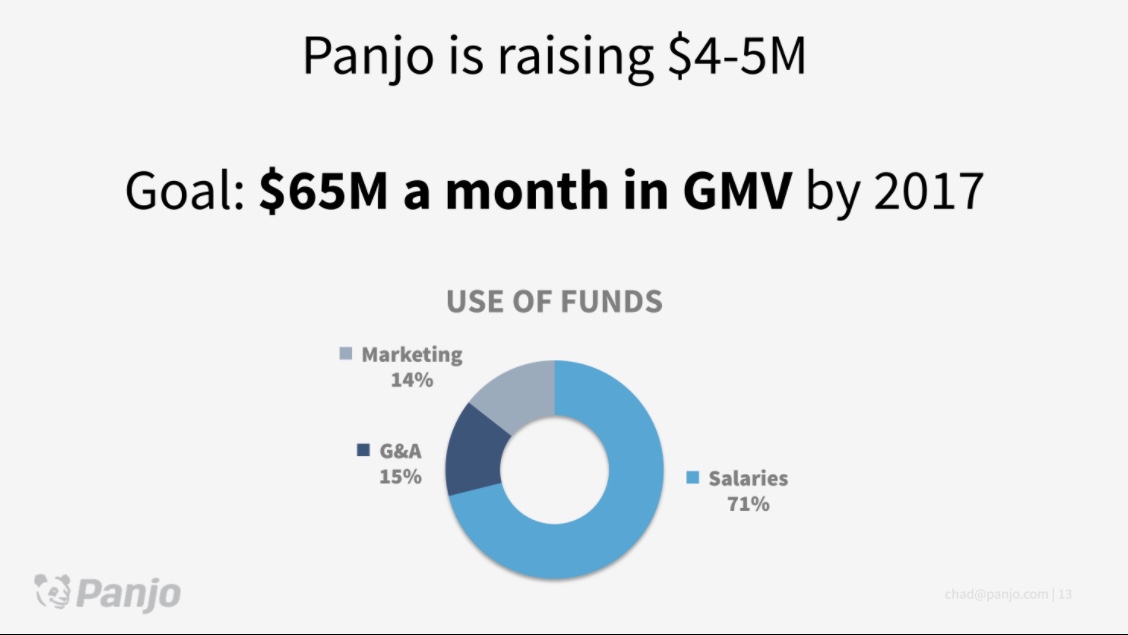
Use of Funds
The use of funds slide describes how much funding you want and why.
Funding should be for specific needs and major milestones. These milestones should be objective and about business validation.
Major Milestones
- Product launch
- First sale
- 100k or 1M users
- $100k or $1M in revenue
- Viral coefficient (k) over 1.0
- Marketplace liquidity over 50%
- LTV > CAC
- Regulatory approval
- Second product launch
- Breakeven
- Positive cash flow
- Profitability
Avoid subjective milestones like “product-market fit” or “scale”. A good major milestone answers “yes” to one of two questions:
- Will achieving this convince investors to fund our next round?
- Will achieving this mean we won’t need investors?
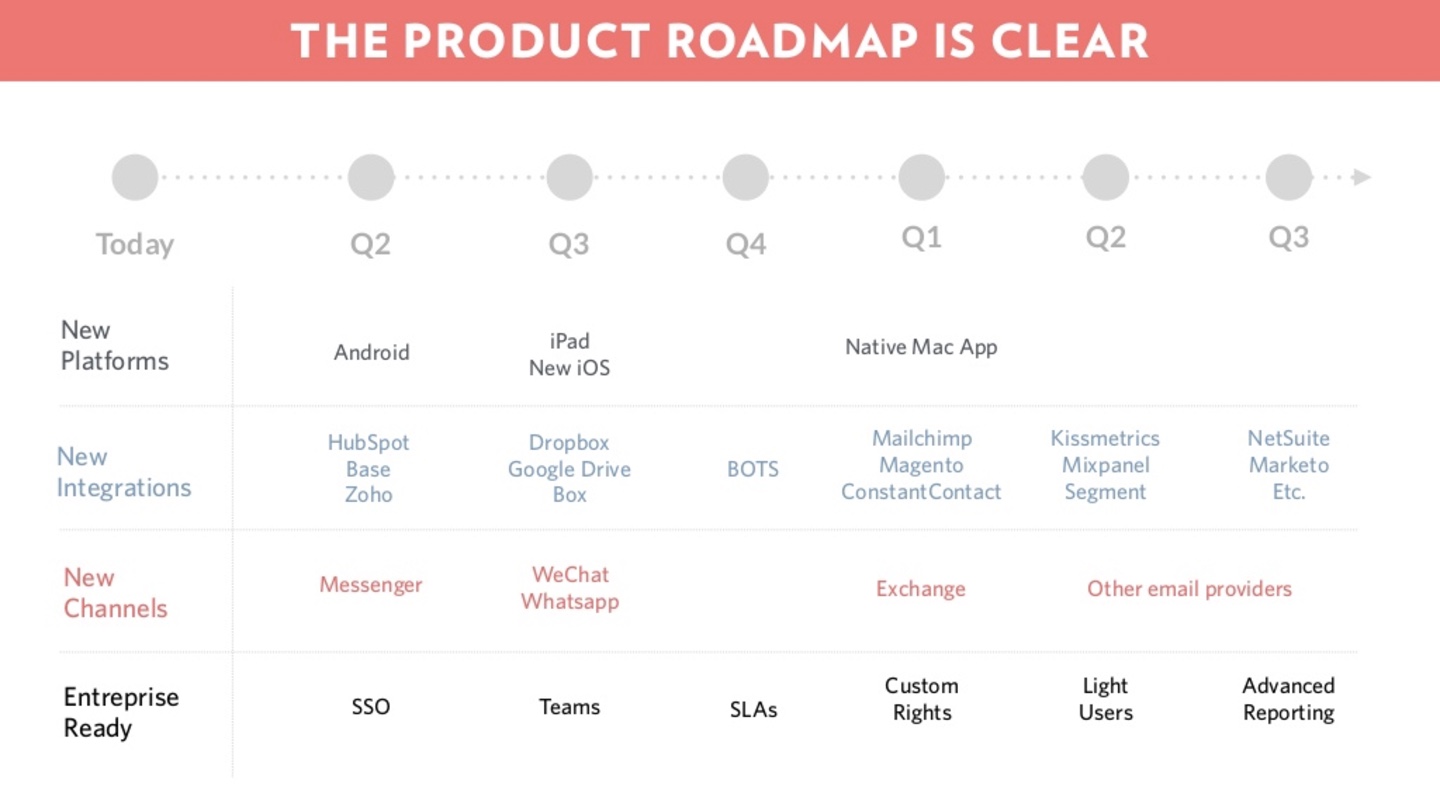
If your success will be product-driven, a product roadmap shows what investors should expect for their money and when. Just be realistic about your development pace.
After setting milestones and timelines, use your projections of costs, customers, revenue, and headcount to determine your funding need. A good funding ask is based on data-driven projections. A bad answer is based on what “feels right” or competitors have raised.
Be clear on how much funding you want. A range (“$3M-$4M”) is okay but don’t expand it beyond 50%. Too large a range suggests poor planning.
Don’t worry about pegging yourself to one number. Investors know many teams are flexible on round sizes, especially above the ask.
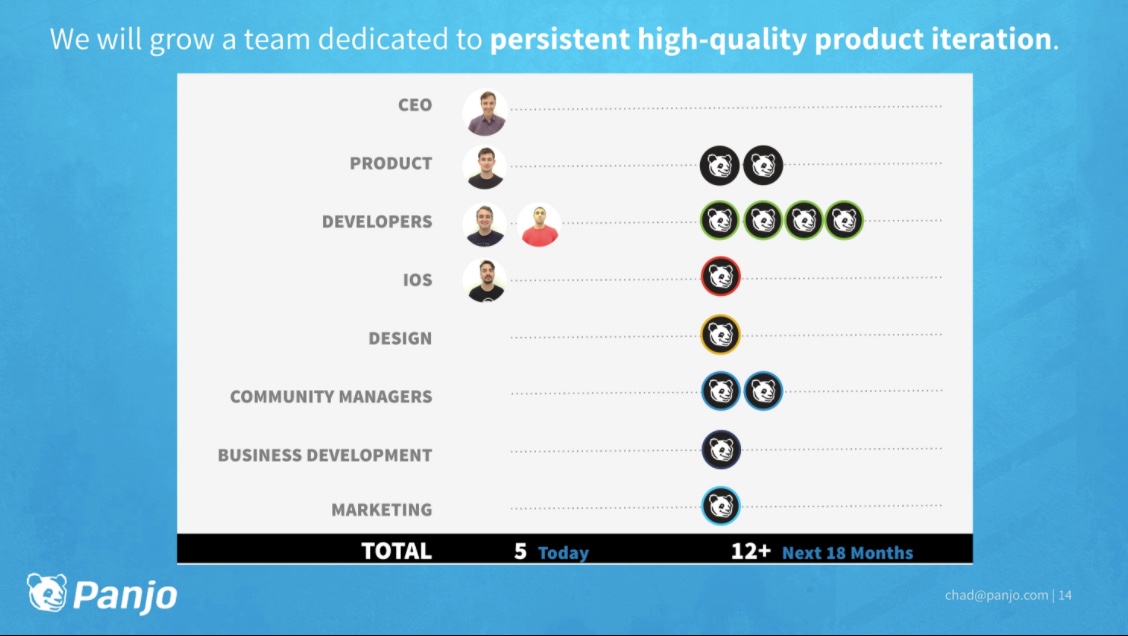
Show the major categories you’ll spend on. People represent 60%-80% of costs in most startups so allocate hires into departments like engineering, product, marketing, sales, operations, and management. Bonus points for showing specific impressive people you will hire with funding.
Other common cost categories include advertising, equipment, manufacturing, services, insurance, legal, licensing, and offices.
If you’ve just started your fundraising, don’t put your expected valuation in the deck. This is negotiated once an investor wants to invest. Setting it upfront will likely either scare investors away or lowball yourself.
However, if you’ve raised more than half of your round and you’re batting away investors, consider including your expected valuation to screen out poor fits.
Finally, reality check your ask to the market. You shouldn’t base your ask on competitors but you should be cautious about asking for 3x higher funding or valuation. That usually only makes sense if you have a substantial market lead or a provenly world-class team.
Conclusion
The conclusion slide is your final message. It can be a summary, a thank you note, contact information, or even a joke.
What to choose depends on your narrative and branding. I like three items:
- Summary of the pitch’s 3-4 key points
- Contact information for the CEO
- Links to resources
Plenty of decks have no conclusion slide at all, but I think that ends too abruptly, like a short story without the last page.
The three items above finish your story, offer resources to learn more, and show how to follow-up. Decks without this lose a chance to make their deck more actionable. If an investor reaches your conclusion slide and is mulling whether to engage or pass, make it easy for them to engage.

Final Tips
- Get your deck professionally designed. Good content + bad design = a bad deck.
- Send your deck through an online document service like Docsend or Clearslide. You can control access, track readers, see analytics, and maintain formatting across devices.
- Regularly update your deck as you make progress.
Your pitch deck is more than a fundraising tool. It’s an opportunity to understand your business deeply. Building a great deck makes you a better founder.
Resources
- Startup Pitch Decks, a Slideshare by Steve Schlafman, RRE Ventures
- Get Funded, a book by Evan Baehr and Evan Loomis
This is the most succinct guide to building a pitch deck that I have read. Thank you.
Awesome critical analysis, hats off the breakdown and sources used.
Thank you so much! I’ve been scouring the interwebs for this.
helpful and comprehensive – kudos!
Genuinely one of the best summaries on the net!